• HOME
  • TRADING ▼
    • STOCK ▼
      • BASIC STOCK KNOWLEDGE
      • DAY TRADING STRATEGIES
      • [UPDATED] BEST STOCKS TO BUY TOMORROW IN US CANADA
    • FOREX ▼
      • TRADING GOLD
      • FOREX KING TRADER FREE TRAINING
    • TRADING COURSES
    • ALL TRADING CANDLESTICK PATTERNS
  • BUSINESS
  • SUPPORT
  • DOWNLOAD
    • 100+ Chart Patterns in Technical Analysis Download For Free [PDF| Printable]
    • A Complete Guide To Volume Price Analysis Summary [DOWNLOAD PDF]
  • QUIZZES
    • Stock Trading Quizzes
  • APP

Trading Strategy Library- KINGTRADER.NET

Trading Resource Download For Free!

Ascending Bases Stock Chart Pattern And Real Examples

Ascending Bases Stock Chart Pattern And Real Examples

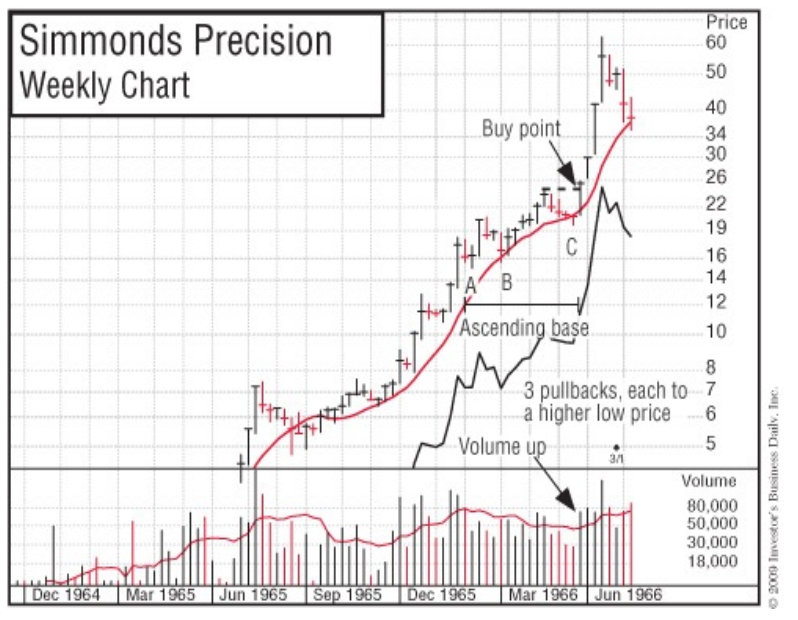
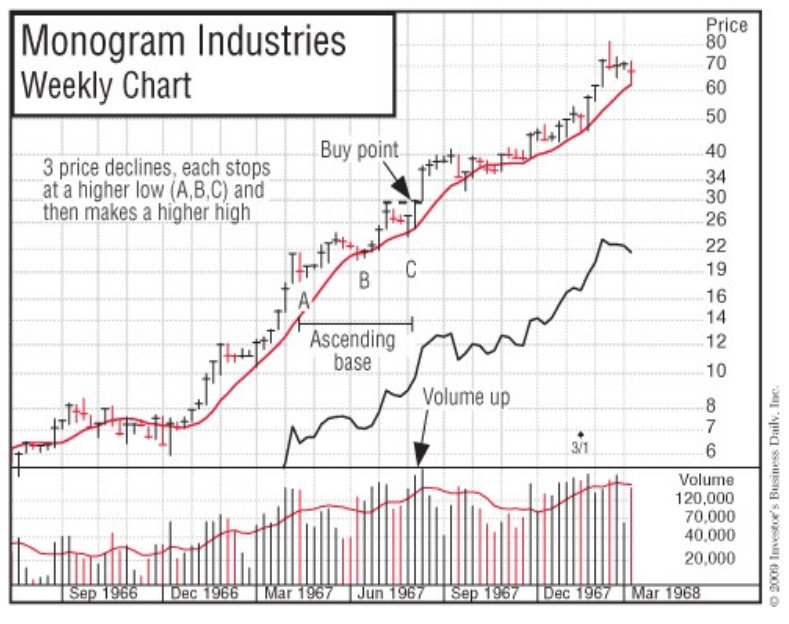
Ascending bases, like flat bases, occur midway along a move up after a stock has broken out of a cup-with-handle or double-bottom base. They have three pullbacks of from 10% to 20%, with each low point during the sell-off in price being higher than the preceding one, which is why I call them ascending bases.
Each of the pullbacks usually occurs because the general market is declining at that time.
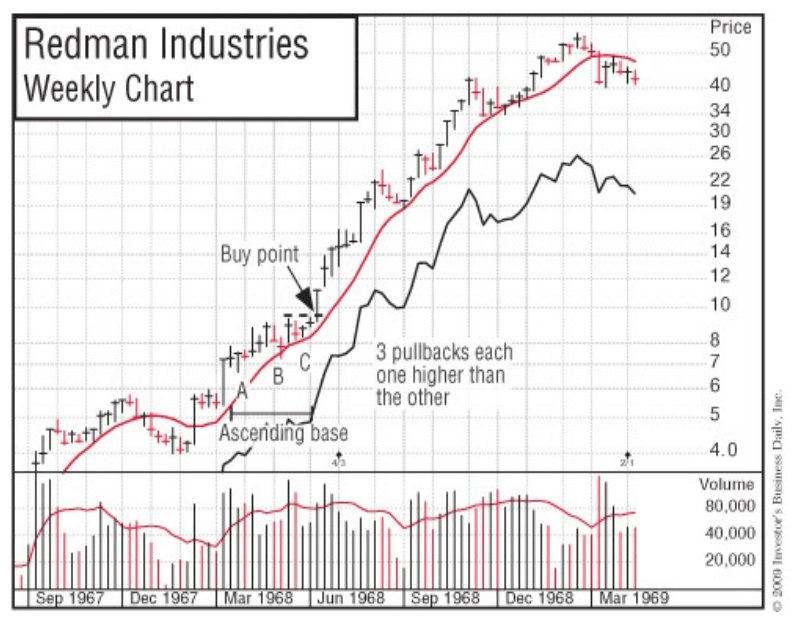
Boeing formed a 13-week ascending base in the second quarter of 1954 and then doubled in price. Redman Industries, a builder of mobile homes, had an 11- week ascending base in the first quarter of 1968 and proceeded to increase 500% in just 37 weeks. America Online created the same type of base in the first quarter of 1999 and resumed what turned out to be a 500% run-up from the breakout of a 14-week cup with handle in October 1998.
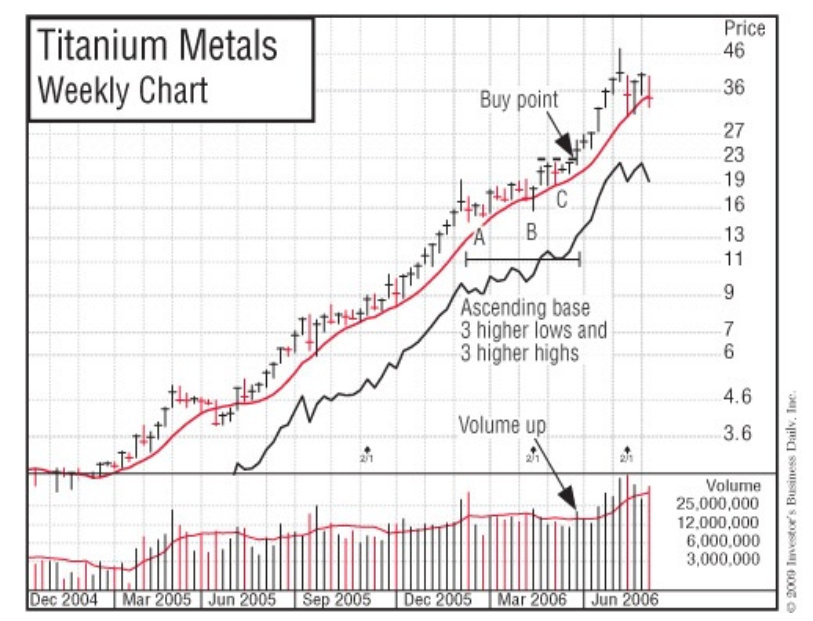
So you see, history does repeat itself. The more historical patterns you know and come to recognize, the more money you should be able to make in future markets. (See the chart examples in Chapter 1. and also Simmonds Precision, Monogram Industries, Redman Industries, America Online, and Titanium Metals.

Real Examples For Ascending Bases Stock Chart Pattern 

How useful was this post?

Click on a star to rate it!

Average rating 5 / 5. Vote count: 113

No votes so far! Be the first to rate this post.

Related Posts:

  • The real meaning of Price Action TradingThe real meaning of Price Action Trading
  • Top 50 Most Profitable Candlestick Patterns for Trading – Stocks, Forex, Options, and CryptocurrencyTop 50 Most Profitable Candlestick Patterns for…

Leave a Reply Cancel reply

Your email address will not be published. Required fields are marked *

Recent Posts

  • Cashflow Game For Android (Multiplayer): Learn Money Management While Having Fun
  • Top 50 Most Profitable Candlestick Patterns for Trading – Stocks, Forex, Options, and Cryptocurrency
  • What is a Candlestick?
  • What Day Trading is Not?
  • Key terms used in Technical Analysis

© Copyright 2020 - Best Sources For Stock, Forex And Options Traders