Day Trading Basics For Beginners – Lesson 4: How to Find Stocks for Trades
Your next challenge as a new trader is how to find actual trades. You may understand how day trading works, but when it comes to actually finding setups in real time, it can be difficult. I certainly experienced this as a new trader. I was often able to see setups in hindsight when I looked back on charts during the day, but finding them while the day was unfolding was very difficult.
Alpha Predators
You must remember that retail trading does not work on all stocks. It only works on the stocks that have high relative volume. Some stocks like Apple Inc. (ticker: AAPL) will on average trade millions and millions of shares each day, while other stocks on average might trade only 500,000 shares a day. Does this mean you should trade AAPL only? No. High volume will be relative from one stock to another. You don’t just look for high total volume. There are some stocks that on average will trade with much volume. You need to look for what’s above average for that specific stock. Thirty million shares of AAPL traded in one day might very well not be higher than usual. Do not trade AAPL unless it has a very unusual trading volume. If trading volume is not higher than normal, it means that the trading is being dominated by institutional traders and high frequency trading computers. Stay away from it.
Take a look at the AAPL daily chart for the summer of 2016. As you can see, there were only two days that had high relative activity. They’re marked with arrows on the chart. Interestingly enough, when you take a close look at the chart, you realize that on those days the stock gapped up or down. I marked those price gaps in the chart. If you wanted to trade AAPL, you should have traded it only on those days. The other days were comprised of just normal, high frequency, algorithmic trading. Retail traders should stay away from stocks that are trading normally.
The most important characteristics of high relative volume stocks is that these stocks trade independent of what their sector and overall market are doing. When the market is weak, it means that the majority of stocks are selling off. It does not matter if it is Apple, Facebook, Amazon or Exxon. When the market is strong, the prices of the majority of stocks will be going
higher. Similarly, when you hear someone say the market is “bear” or “collapsing,” they don’t mean a specific stock. They mean that the whole stock market is losing its value – all stocks together. The same is true for specific sectors. For example, when the pharmaceutical sector is weak, it means all of the pharmaceutical companies are losing their values together. How do you recognize behavior of market? Index funds such as the Dow Jones Industrial Average (DJIA) or the S&P 500 (SPY) are usually good indicators of what the overall market is doing. If the Dow Jones or the SPY are red, it means that the overall market is weak. If the Dow Jones or SPY are strong, then the overall market will be going higher.
The behavior of stocks that have high relative volume is independent of the overall market. Every day, only a handful of stocks are being traded independently of their sector and the overall market. Day traders trade only those stocks. I call those stocks “Alpha Predators”. In the animal kingdom, an alpha predator is a predator at the top of a food chain upon which no other creatures prey. In day trading, Alpha Predator stocks are the ones that are independent of both the overall market and their sector. The market cannot control them.
Therefore, the next rule is about Alpha Predators;
Rule 7: Retail traders trade only Alpha Predators, high relative volume stocks that have fundamental catalysts and are being traded regardless of the overall market.
What makes a stock an Alpha Predator? Usually it is the release of fundamental news about the stock either the day before or during the same trading day. Important news or events for companies can have huge effects on their value in the market and therefore act as fundamental catalysts for their price action.
As mentioned in Lesson 2, some examples of the fundamental catalysts for stocks that make them suitable for day trading include:
- Earnings reports
- Earnings warnings/pre-announcements
- Earnings surprises
- FDA approval/disapproval
- Mergers/acquisitions
- Alliances/partnerships/major product releases
- Major contract wins/losses
- Restructuring/layoffs/management changes
- Stock splits/buybacks/debt offerings
In Lesson 7, I explain specific day trading strategies such as Momentum, Reversal, VWAP Strategy and Moving Average. For the moment, your main question is, how do I find the stock for each strategy? I categorize stocks for retail trading into three classes. Based on my experiences, this categorization provides some clarity on how to find stocks and on how to adopt a strategy for them. You will find other categories elsewhere, and some of my fellow day traders will disagree with my categorization, saying, with some justification, that it is very simplified.
Before explaining the three categories, let me explain the definition of “float” and “market capitalization” or “market cap”. Float means the number of shares available for trading. Apple Inc. for example, as of July 2016, had 5.3 billion shares in the market that are available for buying and selling. Apple is considered a “Mega Cap” stock. These stocks usually don’t move much during the day because they require significant volume and money to be traded, so Apple shares might on average change by only one or two dollars each day. They are not very volatile and therefore day traders don’t like trading them. Day traders look for volatility.
On the other hand, there are some stocks that have very low float. For example, Cesca Therapeutics Inc. (ticker: KOOL) has only a 1.2-million-share float. This means that the supply of shares of KOOL stock is low and therefore a large demand can very quickly move the price of the stock. Low float stocks can be volatile and move very fast. Most of the low float stocks are under $10 because they are early stage companies which for the most part are not profitable. They hope to grow, and by growing further, they issue more shares and raise more money from the public market and slowly become mega cap stocks. These low float stocks are called small cap or micro-cap stocks. Day traders love low float stocks.
Now let’s return to the three categories I had just mentioned. The first category consists of low float stocks that are priced under $10. These stocks are extremely volatile, moving 10%, 20%, 100% or even 1000% a day. Yes, there have been these kinds of moves! You must be careful with this category. Just as you can turn your $1,000 into $10,000 in a single trade, your $1,000 can easily turn into $10. Low float stocks under $10 are often highly manipulated and difficult to trade, and therefore only very experienced and highly equipped retail traders should trade these stocks. I personally rarely trade in them. If someone claims to have turned $1,000 into $10,000 in a month, and if it’s true, they must have traded this type of low float stock. No beginner or even intermediate trader can trade with such accuracy and efficiency. If novice traders tried trading low float stocks that are under $10, they would more likely turn their $1,000 into nothing in a matter of days.
When it comes to low float stocks, the Bull Flag Momentum Strategy — which I detail in Lesson 7 — works best. The other strategies in this post are not suitable for low float sub-$10 stocks.
You generally cannot sell short low float stocks that cost less than $10. For short selling, you need to borrow shares from your broker, and it’s rare that a broker will lend you such volatile stocks. Even if your broker is willing to lend them to you, I strongly advise that you do not attempt to short sell them. They can easily surge and you will end up wiping out your account.
You defenitely can become a full-time profitable day trader without short selling risky stocks, so leave that to the Wall Street professionals.
The second category is medium float stocks in the range of $10-$100. These stocks have medium floats of around 5 million to 500 million shares. Most of my strategies explained in this post work well on these stocks, especially the VWAP and Support or Resistance Strategies. Medium float stocks that are more expensive than $100 are not popular among retail day traders and I myself avoid them. You usually cannot buy many shares of them because of their high price. Therefore, it is basically useless to day trade them. Leave them for the institutional traders.
The third category of stocks for trading is mega cap stocks like Apple, Ali Baba, Yahoo, Microsoft and Home Depot. These are well established companies that usually have over $500 million in shares outstanding available for trading. These stocks are traded in millions of shares every day. As you may guess, these stocks move only when large institutional traders, investment banks, and hedge funds are buying or selling large positions. Retail traders like us, who typically trade 100 to 1,000 shares, usually cannot move the price of these stocks. Retail traders should avoid these stocks unless there is a good fundamental catalyst for them. From the strategies set forth in Lesson 7, Reversals and Moving Average Strategies usually work well on these stocks. Do not forget though, unless there is a fundamental catalyst, these stocks are being heavily traded by computers and high frequency traders and are not suitable for retail day trading.
The table below summarizes these categories:
| Float | Price Range | My Favorite Strategy (Lesson 7)
|
| Low float(less than 5 million) | Under $10 | Only Momentum (Long)
|
| Medium float(5-500 million) | $10-$100 | All, mostly VWAP and Support or Resistance |
| Large floats(+500 million) | Any(usually +$20) | All, mostly Moving Average and Reversal
|
Finding Trades
Trades can be found in two ways:
- pre-market morning watch list
- real time intraday scans
Let me explain how each day I find Alpha Predators for trading.
I use my scanner every morning and program it to find stocks suitable for my day trading based on the following criteria:
- Stocks that in the pre-market gapped up or down at least $1
- Stocks that have traded at least 50,000 shares in the pre-market
- Stocks that have an average daily volume of over 1 million shares
- Stocks that have Average True Range of over 50 cents
- There is a fundamental catalyst for the stock Why these criteria?
When there are some fundamental catalysts, there will be unusual pre-market activity. Stocks gap up or down before the market opens with a significant number of shares being traded (such as 50,000 shares). I look for highly traded stocks, so that buying and selling 1,000 shares won’t be a problem. That is why I am looking at stocks with an average daily volume of over 1 million shares. I also am looking for stocks that usually move in a good range for trading. That is why I look at Average True Range (ATR). ATR means how large of a range a stock has on average every day. If ATR is $1, then you can expect the stock to move around $1 daily. That is a good number. If you have 1,000 shares, you may profit $1,000 from the trade. But if ATR is only 10 cents, then the trading range is not attractive for me.
Let’s look at an example of how my watch list will form. On August 19, 2016 at 9 a.m. (Eastern time), my scanner showed these stocks: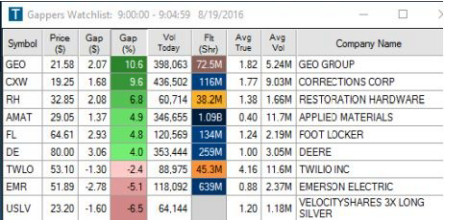
As you can see, I have highlighted the Gap% and Float columns on my watch list. From over 4,000 stocks, I now have only nine candidates. I will go over each of them before the market opens at 9:30 a.m. I will check the news on each of them to learn why they gapped up or down. Is there a fundamental catalyst for that stock? Has there been any news coverage or extreme events for the company?
From these nine, I usually select three or four stocks to watch closely. You cannot watch nine stocks, and regardless, there are usually no more than two or three good candidates. I watch them closely on my screen, looking for potential setups. I plan my trades before the market opens and then wait for the market bell. I then trade my plan.
For some strategies, you cannot find stocks in the pre-market. The Momentum, Top, and Bottom Reversal Strategies explained in Lesson 7 are the types of strategies applicable for when a setup suitable for trading happens, and that is usually during trading hours. It is hard to find these stocks during a pre-market scan watch list. For these strategies, I have specific scanners that look for these stocks and I will explain these scanners in detail in Lesson 7.
Real Time Volume Radar
During the day, there may be some Alpha Predators in the market that I did not catch in my morning watch list. Therefore, I have a scanner on my Trade Ideas software (see Lesson 5) that is set to find real time stocks for me that:
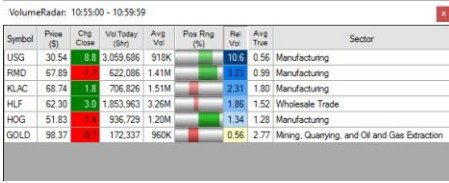
- Have gapped up or down at least $1
- Have ATR of more than 50 cents
- Have average relative volume of at least 1.5
- Have average daily trading volume of at least 500,000 shares
These are my requirements for an Alpha Predator. Having ATR of more than 50 cents is important because you want stock to move during the day so you can make profit out of its volatility. There is no point in trading a stock that is moving only 5 cents on average in a day.
I will also take a look at the sector of stocks. If I have a few stocks in one sector, there is a good chance that these stocks are not Alpha Predators. They have high relative volume because their sector is under heavy trading by institutional traders. It is important to know that stocks usually trade with their sector. For example, when oil stocks are selling off, almost all of the oil companies sell off. Therefore, it is important to recognize your real Alpha Predators from the herd.
For the Momentum Strategy, as I explained above, you need to find low float stocks that are moving. You cannot find these stocks unless you are using a good scanner. I am using the Trade Ideas scanner.
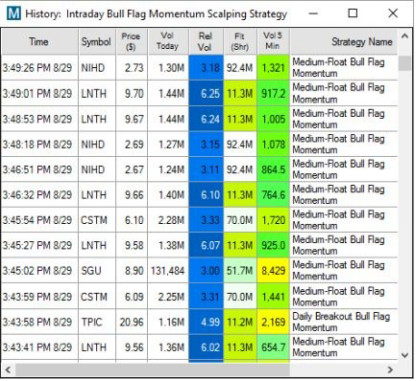
My intraday real time Bull Flag Momentum scanner.
In the screenshot above, you can see how I am scanning real time for my Momentum Strategy. During the day, the scanner is finding stocks that have high relative volume, low float, and high activity. I then check them in my trading platform and decide, based on my Momentum Strategy set out in Lesson 7, if I want to trade them.
Real Time Reversal Scanners
Top and Bottom Reversal Strategy is another type of strategy that you cannot find stocks for in the pre-market. You must have an intraday real time scanner. Here is an image of a Top and Bottom Reversal scan:
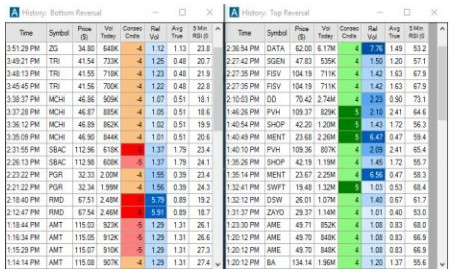
My intraday real time Reversal scanner.
As you can see, I am scanning the market real time to find stocks that are selling off or surging up so I can trade my Reversal Strategies. You can read more about these strategies in Lesson 7.
I won’t go into the details here about how to make these scans, but I will explain in Lesson 7 under each strategy the specifics of what to look for in stocks in each category. If you develop new strategies for yourself, you can define new scanners for yourself. These scanners are highly adjustable and you can change the parameters as you like. These are the parameters that work for me, but as you gain experience and learn more about other strategies and your trading style, you may very well decide to define new scanners for yourself.
Many new traders don’t initially need a scanner. If you join a community of day traders such as www.Kingtrader.net, you will be able to see my scanner in real time. These scanners are costly, around $100 per month, so at the beginning of your career transition to day trading, you will probably want to keep your expenses down as much as possible.
Planning the Trade Based on Scanners
Once I Find my daily Alpha Predators (the stocks that are independent of the overall market) I start to look for the individual setups in them. I constantly monitor their charts and try to plan a trade based on the strategies detailed in Lesson 7. I usually select three Alpha Predators and watch them separately on my three monitors. When I see a potential strategy, I plan my trade. This is a fast decision making process. Sometimes you have to plan a trade in a few minutes and at other times in just a few seconds. This is why you need months of training in simulator accounts to well understand the decision making process.
I focus considerably on quality versus quantity. There are millions of traders out there and there are no doubt millions of strategies out there as well. I had to find the strategy that worked best for me, my personality and my account size. I’ve found a strategy that works really well for my students as well as for my own personal trading. This strategy involves taking only the best setups and waiting on the sidelines until I see something worth trading.
Day trading can be a boring profession – most of the time you are just sitting and watching your list. In fact, if day trading is not boring for you, then you are probably over-trading.
If you require a reminder of the importance of patience in trading, here it is. There are plenty of traders out there who are making the error of over-trading. Over-trading can mean trading 20, 30, 40, or even 60 times a day. If you do that, your broker will love you. You’ll be commissioning them to do all of those trades, so you are going to lose both money and commissions. Many brokers charge $4.95 for each trade, so for 40 trades, you will end up paying $200 per day to your broker. That is a lot. Remember, your goal is to trade well, not to trade often.
Another problem with over-trading is risk. While you’re in a trade you’re exposed to risk, and that’s a place you don’t want to be unless you have proven that there is a setup in the strategy worth trading.
Here is my next golden rule:
Rule 8: Experienced traders are like guerrilla soldiers. They jump out at just the right time, take their profit, and get out.
The stock market is controlled by machines and highly sophisticated algorithms and, as a result, there is considerable high frequency trading. High frequency trading creates significant noise in the price action and is specifically designed to shake out retail traders like you and me. You must be smart. Don’t expose yourself to them. Profit table traders usually make only two or three trades each day. They then cash out and enjoy the rest of their day.


Leave a Reply