Market analysis as of September 30, 2026, before Micron’s scheduled US earnings call. Company figures below refer to their stated fiscal periods, not a common calendar quarter.
The AI spending boom is one of the strongest current themes connecting trading and business. It links semiconductor orders, cloud growth, enterprise software adoption and the cost of financing new capacity. Yet the most useful question for investors and business owners is more precise than whether artificial intelligence will grow: who can turn that growth into durable cash flow, and how much success is already reflected in the share price?
Recent market coverage supports that focus. Reuters’ September 29 commentary identifies AI infrastructure investment as a major force behind current growth and earnings. Investor’s Business Daily’s September 28 analysis describes a third-quarter shift away from some capital-intensive AI infrastructure names toward enterprise software. These are market observations, not proof that every software company will outperform or that hardware demand is ending. [1] [2]
The core problem: one company’s spending is another company’s revenue
AI investment can produce very different economics at different points in the same supply chain. A chip supplier can recognise a sale when equipment is delivered under the relevant accounting rules. Its customer then has to install that equipment, secure power, attract workloads and collect enough revenue to cover the investment. The supplier’s success does not automatically establish the customer’s return on capital.
For analytical purposes, separate the ecosystem into four layers: infrastructure suppliers, cloud and model operators, application providers, and business customers. Each layer has a distinct test. Suppliers need durable orders and pricing power. Operators need utilisation and cash generation. Applications need paying users and sustainable service costs. Customers need measurable improvements to their own operations.
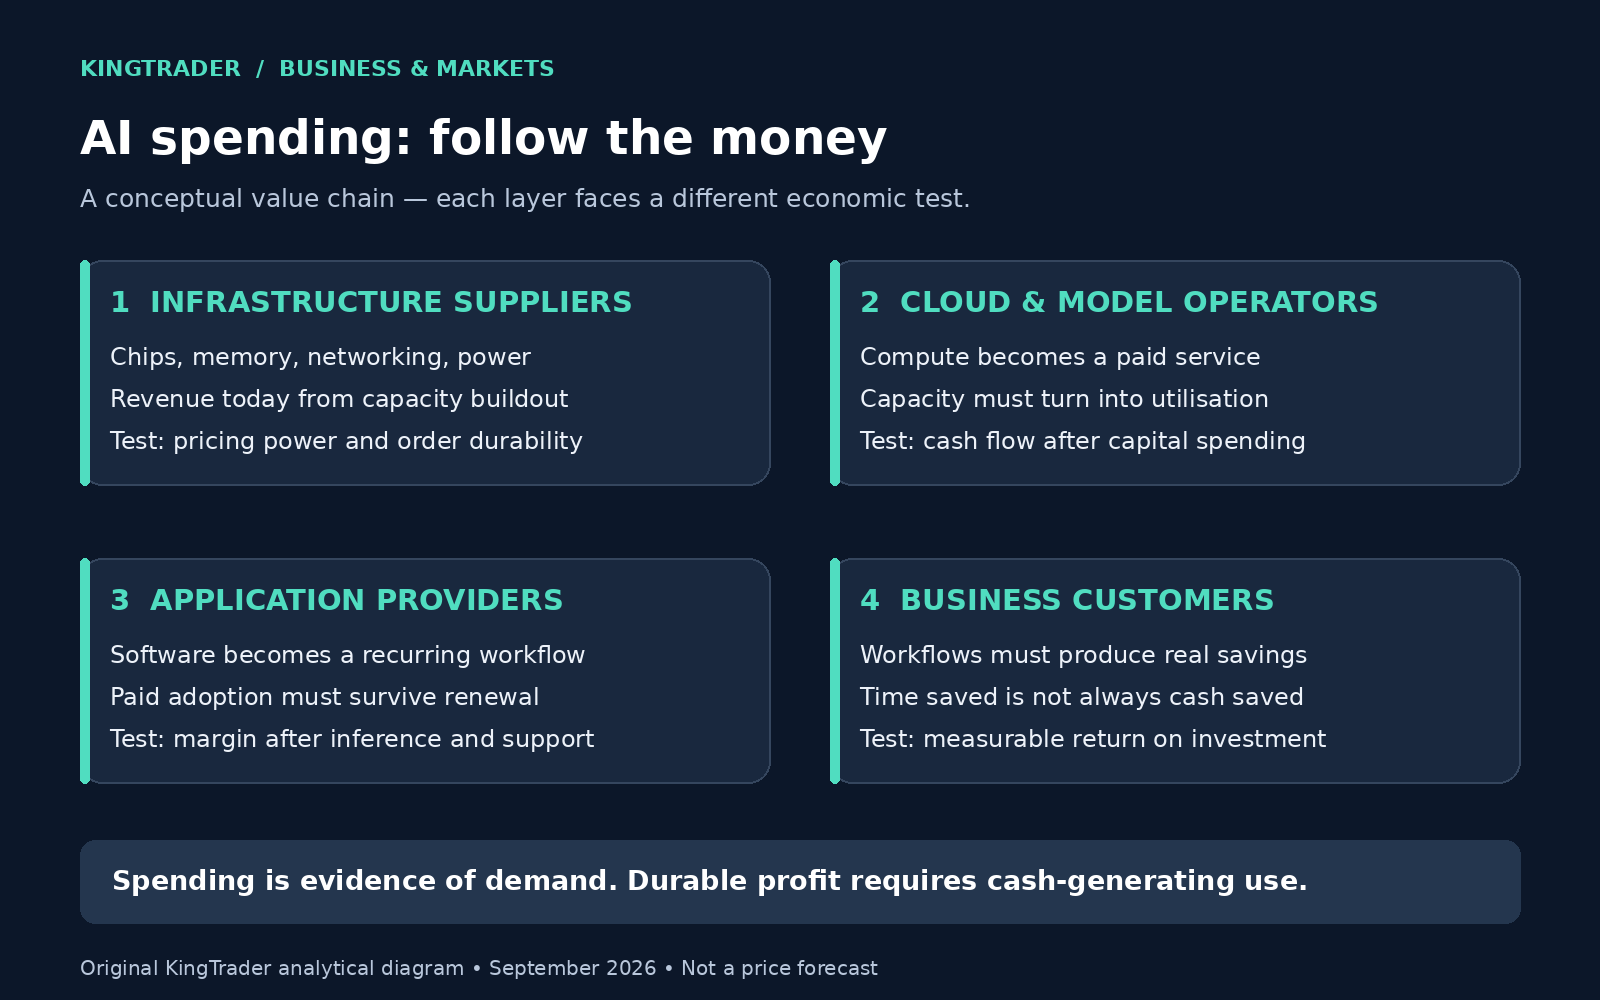
The investment trap is to treat all four layers as if they earn the same margins and face the same risks. They do not. A shortage can strengthen a supplier’s negotiating position while increasing an operator’s costs. Cheaper computing can improve an application’s economics while weakening the pricing power of a hardware vendor. The location of value can change even when adoption keeps expanding.
Example 1: NVIDIA shows the scale of infrastructure demand
NVIDIA’s August 26 release, filed with the SEC, reported revenue of $96.2 billion for fiscal Q2 2027, ended July 26, 2026, up 106% year over year. Data Center revenue was $89.0 billion, up 117%. GAAP gross margin was 75.0%. Its next-quarter revenue outlook was $108.0 billion, plus or minus 2%, with no Data Center compute revenue from China assumed. That outlook is management guidance, not an achieved result. [3]
Our interpretation is that a supplier can already be monetising the buildout while the ultimate economics of some customers remain unsettled. For a research file, ask whether repeat purchases depend on independently profitable workloads, how exposed orders are to a small group of buyers, and what could change pricing power. Strong reported growth should begin that investigation rather than end it.
Example 2: Microsoft illustrates the monetisation and investment balance
For fiscal Q4 2026, ended June 30, Microsoft reported Microsoft Cloud revenue of $59.3 billion, up 27% year over year; Azure and other cloud services revenue grew 43%. The release also said Microsoft 365 Copilot had exceeded 30 million paid seats. Microsoft Cloud includes more than AI, so its revenue must not be labelled pure AI revenue. [4]
On the earnings call, management reported quarterly capital expenditures of $41 billion and free cash flow of $19.6 billion. The cash-flow bridge was $55.4 billion of operating cash flow less $35.8 billion cash paid for property, plant and equipment, giving $19.6 billion. Reported capex also includes finance-lease effects; subtracting that full figure from free cash flow again would be wrong. [5]
Our analytical takeaway is to monitor paid adoption alongside cash conversion. A growing seat count does not reveal every user’s activity, renewal intention or incremental profitability. Before valuing an AI product, investigate whether customers expand usage because it improves a recurring workflow and whether the provider can serve that usage economically. Revenue, engagement and cash flow answer different questions.
Example 3: Micron highlights memory demand and event risk
Micron’s fiscal Q3 2026, ended May 28, produced revenue of $41.46 billion, operating cash flow of $25.39 billion and adjusted free cash flow of $18.3 billion. Its June 24 release said HBM4 was in high-volume shipments for its lead customer’s platform. HBM is high-bandwidth memory used alongside advanced computing hardware. [6]
The company scheduled its fiscal Q4 earnings call for September 30 at 2:30 p.m. Mountain time. That event is still ahead at this article’s publication cutoff; the prior quarter and any guidance must not be described as newly released Q4 results. [7]
For traders, this is an event-analysis case. Write down the metrics that would change the thesis before the release: demand visibility, capacity additions, customer commitments and forward margins. Then compare the actual disclosure with that checklist. A headline earnings beat can be less informative than a change in the outlook.
Why good earnings can still produce a bad investment
A company’s performance and the return on its stock are separate calculations. A simplified valuation model is share price = earnings per share × the price-to-earnings multiple. Both terms can change. Investors can correctly predict higher earnings and still lose money if they pay a multiple that subsequently contracts.
Hypothetical example: a business earns $5 per share and trades at 40 times earnings, giving a $200 share price. Earnings rise 20% to $6, but the market values those earnings at 30 times. The resulting price is $180, a 10% decline before dividends and transaction costs. These are illustrative numbers, not a valuation of NVIDIA, Microsoft or Micron.
This is why a forecast should contain at least three cases. The positive case combines stronger paid demand with stable margins. The middle case allows growth to continue while valuation falls. The adverse case includes delayed orders, weaker pricing or higher financing costs. Assigning a precise probability without supporting evidence creates false confidence; the useful exercise is to identify what would make each case plausible.
Interest rates add another dimension. In a discounted-cash-flow model, holding future cash flows constant, a higher discount rate lowers their present value. Actual stock prices also reflect changing earnings expectations and risk premiums. A rising yield therefore does not mechanically dictate the next day’s direction, but it is a reason to test how much distant growth a valuation requires.
A practical research framework for AI stocks
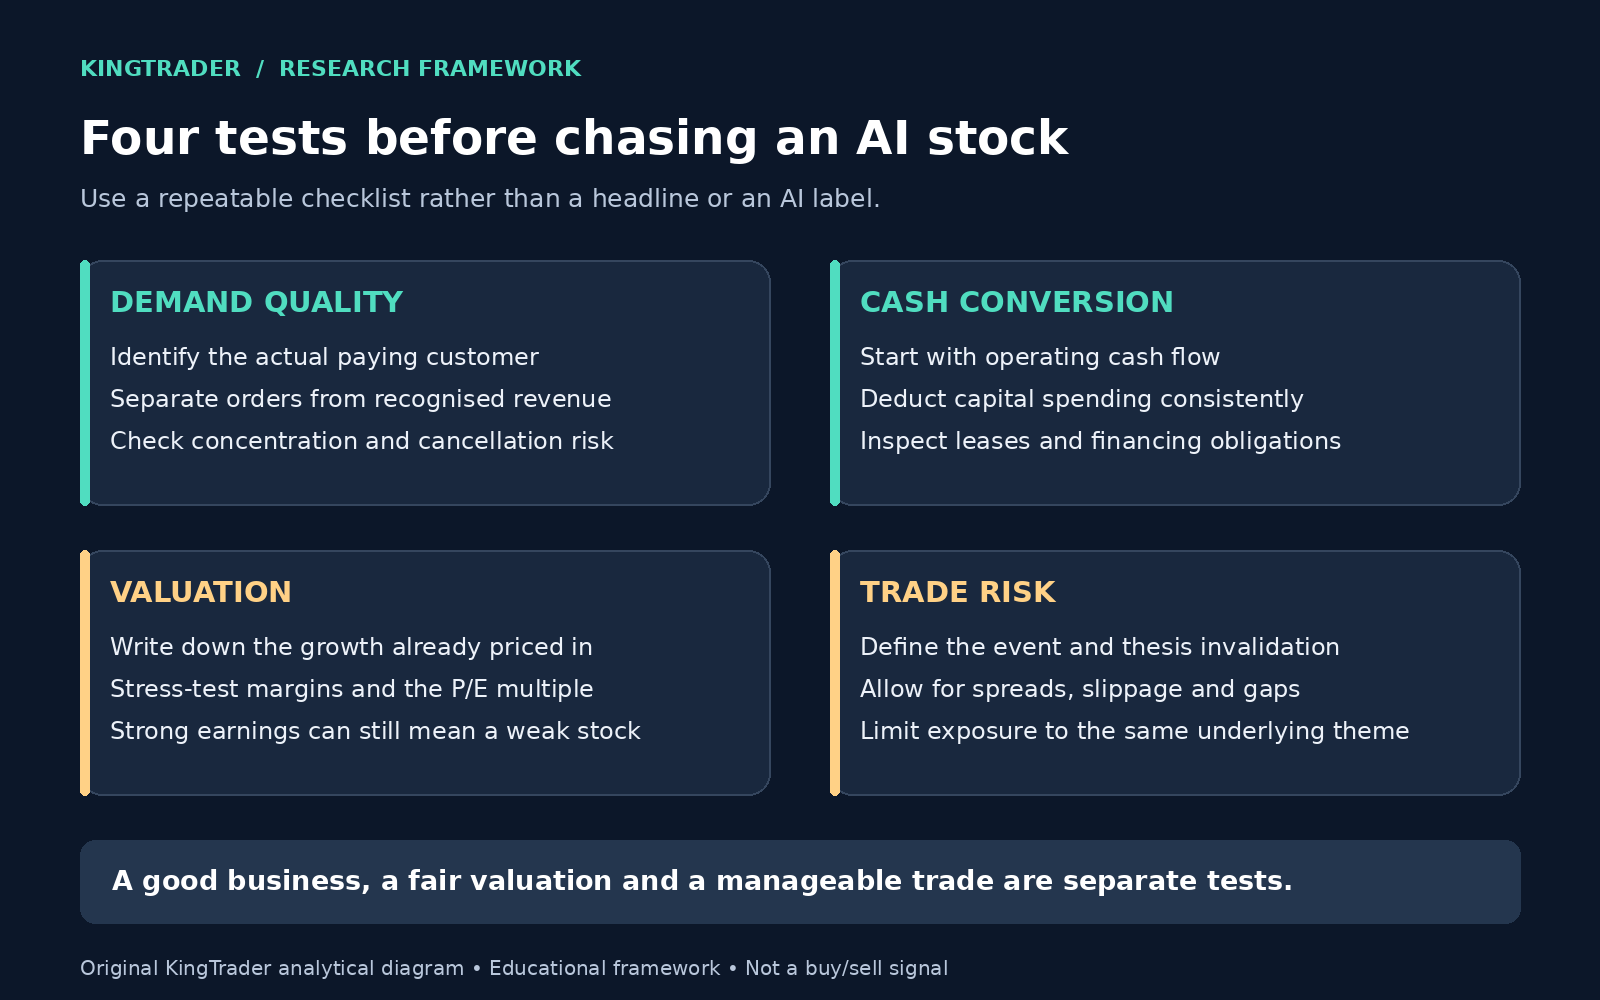
First, identify the paying customer. Separate announcements, orders, contracted commitments and recognised revenue. Ask whether customers are paying from their own operating cash generation or depend on continued fundraising. Neither source automatically invalidates demand, but the difference affects how resilient purchases may be in a financing slowdown.
Second, examine cash conversion. A useful starting point is operating cash flow less cash capital expenditure. Reconcile that calculation to the company’s own free-cash-flow definition and inspect lease obligations separately. Compare like periods and read the notes. Hardware suppliers, cloud operators and software businesses should not be ranked solely on an unreconciled headline cash-flow number.
Third, test what the price assumes. Record the growth, margins and valuation multiple required by the thesis. Ask what happens if adoption arrives later than expected. A compelling technology narrative cannot compensate for a model that needs every assumption to improve simultaneously.
Fourth, define the trade’s failure condition. A long-term business view and a short-term entry need different evidence. Specify the event, time horizon, liquidity conditions and information that would invalidate the position. Treat exposure to several AI-related stocks as potentially overlapping exposure to the same spending cycle, rather than automatically assuming diversification.
The business-owner opportunity: sell a measurable outcome
For an entrepreneur, the same analysis leads to a different action. Instead of launching a generic AI service, choose a recurring customer problem with an observable baseline. Examples include invoice handling, support-ticket routing or preparation of routine sales documents. The product should improve a task that someone already pays to perform.
Hypothetical pilot: a team processes 2,000 routine documents per month. An assisted workflow saves three minutes per document after human review. That is 6,000 minutes, or 100 hours. At an assumed fully loaded labour cost of $25 an hour, the value of released capacity is $2,500 per month. If software, model usage and ongoing supervision cost $900, the estimated net capacity value is $1,600.
That $1,600 is not automatically additional profit or cash savings. If employees remain on the same payroll and the freed hours are unused, the benefit is spare capacity. Cash value appears when the business reduces paid overtime, avoids a planned hire or uses that capacity to produce additional contribution profit. Count only benefits that can be demonstrated.
Include implementation costs as well. If this hypothetical pilot requires $4,800 upfront and actually produces $1,600 in monthly net cash benefit, simple payback is three months. If only half of the $2,500 gross capacity value becomes cash, while the $900 recurring cost remains unchanged, the cash benefit falls to $350 and payback extends to about 13.7 months. This sensitivity exposes the core problem: optimistic time-saving assumptions can conceal weak economics.
Run a controlled pilot with a baseline, consistent task selection and a clear error-rate measure. Include exception handling, privacy controls and rework time. Expand only after the customer can verify the result. A smaller workflow with reliable economics is a stronger business foundation than a broad claim about transformation.
Trading the theme requires a plan for uncertainty
Earnings events can cause prices to gap beyond a planned stop. A position-size calculation is useful, but it does not guarantee the maximum loss. For example, an illustrative $10,000 account with a planned $50 risk budget and a $2 entry-to-stop distance permits 25 shares before fees and slippage. A gap, thin liquidity or a wider spread can produce a larger loss.
Before entering, write down the catalyst and the evidence needed for follow-through. Check whether the market is responding to stronger future economics or simply to a headline. Afterward, log the result, including execution costs and whether the original thesis survived. This makes the next decision more disciplined than chasing whichever ticker is trending.
What to watch as the AI boom moves into Q4
The most informative signals are repeat purchases from financially credible customers, paid usage that survives renewal, sustainable service margins and cash generation after investment. Warning signs include growth driven by weak customer economics, expensive capacity sitting idle and valuation assumptions that leave little room for delay.
The opportunity remains worth researching because it spans both markets and operating businesses. Its core challenge is converting spending into productive use. Traders should assess the difference between business progress and the expectations embedded in price. Business owners should measure the difference between time saved and cash earned. Both approaches begin by following the money to an outcome that can be verified.
Educational market and business analysis, not personalised investment advice. Company disclosures are dated historical evidence; management outlooks are uncertain. The two graphics and hypothetical calculations are original analytical material.
Sources and verification notes
- Reuters, September 29, 2026: AI investment and the macroeconomic backdrop (commentary).
- Investor’s Business Daily, September 28, 2026: Q3 AI stock leadership (market reporting).
- NVIDIA fiscal Q2 2027 earnings release, August 26, 2026 (SEC-filed company disclosure).
- Microsoft fiscal Q4 2026 earnings release, July 29, 2026 (company disclosure).
- Microsoft fiscal Q4 2026 earnings-call transcript (management commentary and financial definitions).
- Micron fiscal Q3 2026 release, June 24, 2026 (company disclosure; free cash flow is adjusted).
- Micron fiscal Q4 earnings-call announcement (event schedule; no Q4 actual results assumed).
Leave a Reply