Gold trading in 2026 has exposed a weakness in one of the market’s most familiar shortcuts: inflation rises, so gold must rise. An energy shock can increase inflation pressure while also pushing investors toward higher interest-rate expectations and a stronger dollar. Those forces can pull the metal in opposite directions.
The core problem is that gold has several roles at once. It is a reserve asset, a store of purchasing power, a traded financial asset and a physical good. Its short-term price reflects the buyer willing to transact at the margin, not a single timeless relationship with consumer prices. Understanding the conflict matters more than repeating the inflation-hedge label.
Research cutoff: September 30, 2026. Price observations are historical snapshots, not live quotes. Scenarios are illustrative and do not predict returns.
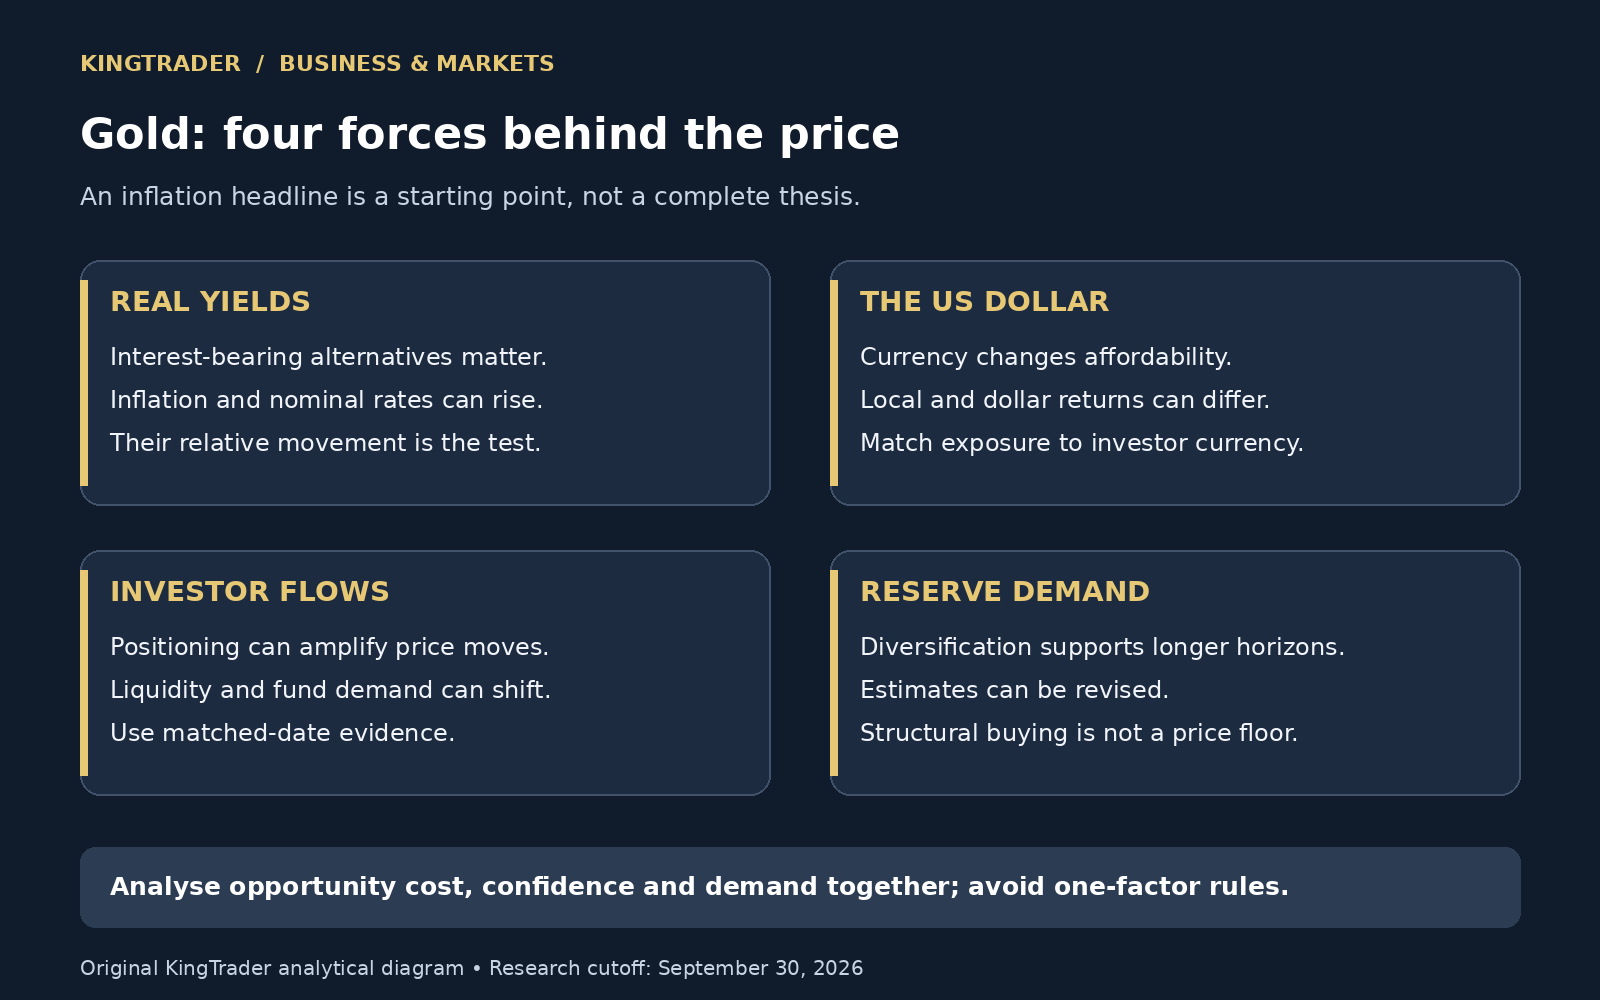
The September example: an energy shock can hurt gold
On September 29, Reuters reported spot gold at $4,142.89 an ounce at 17:55 GMT, up 0.7% on the day. It followed a nearly 4% fall on Monday as higher yields and a stronger dollar weighed on bullion amid energy-driven inflation concerns. This is a dated market snapshot, not a current executable price.
The sequence explains the analytical challenge. Inflation worries did not produce a simple, immediate hedge payoff. Traders also revised the expected path of monetary policy and the return available on interest-bearing assets. A safe-haven narrative competed with the opportunity cost of owning a metal that pays no coupon.
One day’s rebound does not settle that conflict. A market can recover after a sharp selloff because positioning was stretched, liquidity changed or investors reassessed the outlook. To distinguish a durable shift from a bounce, the analyst needs evidence across yields, currency, flows and price behaviour over a consistent period.
Real yields: the missing piece in the inflation argument
A nominal bond yield includes compensation for several risks, while a real yield relates the return to inflation. A common forward-looking proxy is the yield on inflation-protected government debt. A rough nominal yield minus expected inflation calculation can help explain the idea, but it is not a complete substitute for market pricing.
Consider two hypothetical settings. In the first, a nominal yield is 5% and expected inflation is 3%, producing an approximate real yield of 2%. In the second, the nominal yield rises to 6% while expected inflation rises to 3.5%. The rough real yield becomes 2.5%. Inflation expectations increased, yet the real return offered by the bond also increased.
That change can make gold more expensive to hold relative to an interest-bearing alternative. It does not force gold lower: reserve demand, confidence shocks and other flows can offset it. But it explains why rising inflation alone is insufficient to establish a trading thesis.
The World Gold Council’s August 2026 market commentary, published September 9, discusses gold in relation to real yields, the dollar and market conditions. Historical relationships are useful research inputs, not fixed equations that guarantee a future price move.
The dollar changes both affordability and portfolio choices
Gold is widely quoted in US dollars. A stronger dollar can make the same dollar gold price more expensive for buyers using other currencies. It can also accompany tighter financial conditions or a change in demand for liquid dollar assets.
However, local-currency returns can diverge from the dollar chart. A buyer whose home currency weakens might experience a rising local gold price even while dollar gold is flat. This is why a global commodity headline should be translated into the investor’s actual currency exposure.
For a trading plan, separate the metal thesis from the exchange-rate thesis. A dollar-denominated fund, a locally quoted bullion product and a futures contract can have different currency and settlement mechanics. The product documentation determines the exposure; the label “gold” does not answer the question by itself.
Central-bank demand is structural support, not a price floor
The World Gold Council’s second-quarter 2026 demand report estimated central-bank net purchases at 289 tonnes, up from a revised first-quarter estimate of 57 tonnes. These are estimates that can change as information becomes available; the revision itself is a reason to check the latest dataset.
Reserve managers make decisions on a different horizon from a leveraged futures trader. Their interest in diversification can support long-term demand without preventing a near-term selloff. Buying is also not necessarily evenly spread through a quarter or immediately visible in public statistics.
This creates a useful distinction between a structural thesis and a trade entry. A long-term belief in reserve diversification does not establish that a particular purchase price is attractive. Short-term liquidity, investor selling and changing yields can overwhelm the flow that supports the longer story.
Physical demand adds further complexity. Higher prices increase the value of purchases but can reduce the quantity that jewellery buyers afford. Recycling can rise when owners sell into strength. An analysis that cites demand in dollars without checking tonnes may confuse a price effect with stronger physical consumption.
Newmont: gold exposure becomes a business with operating risk
Newmont’s July 23 second-quarter 2026 release reported approximately 1.3 million attributable gold ounces, $2.2 billion of free cash flow and gold by-product all-in sustaining costs of $1,621 an ounce. Free cash flow and AISC are non-GAAP measures, with definitions and reconciliations in the release.
The example shows how higher realised gold prices can support a substantial operating cash engine. But buying a miner is not equivalent to buying the metal. Shareholders own exposure to geology, production execution, labour, energy, capital allocation, jurisdictions and the company’s balance sheet as well as gold prices.
AISC is especially easy to misuse. It is useful for assessing sustaining economics under the company’s methodology. It is not a universal all-expenses-included net-profit figure. Subtracting it from a current spot quote does not produce earnings per ounce: realised prices, by-product credits, volume, tax, financing and other investment requirements all matter.
Comparisons also need consistent definitions. By-product and co-product cost measures allocate other metals differently. Comparing one company’s by-product AISC with another’s differently defined measure can create a false impression of cost leadership. Read the footnotes before ranking miners on a single number.
A hypothetical miner reveals the operating leverage
Imagine a simplified producer selling one million ounces a year at $3,000 per ounce, with $1,800 of cash operating and sustaining costs per ounce. The spread is $1,200 per ounce, or $1.2 billion before the other expenses excluded from this simplified model.
If gold rises 10% to $3,300 and those costs stay fixed, the spread rises to $1,500, an increase of 25%. That is the attraction of operating leverage. It also works in reverse: a 10% fall to $2,700 cuts the spread to $900, a 25% reduction.
Now add an energy shock that raises the assumed cost to $2,000 while gold is $2,700. The spread falls to $700, down roughly 42% from the original $1,200. The business is exposed to both the selling price and the cost of producing the output.
These invented numbers are not Newmont guidance. They explain why mining shares can move more dramatically than bullion, yet still fail to provide a predictable multiple of gold’s return. Valuation, production changes and financing can dominate the simple sensitivity.
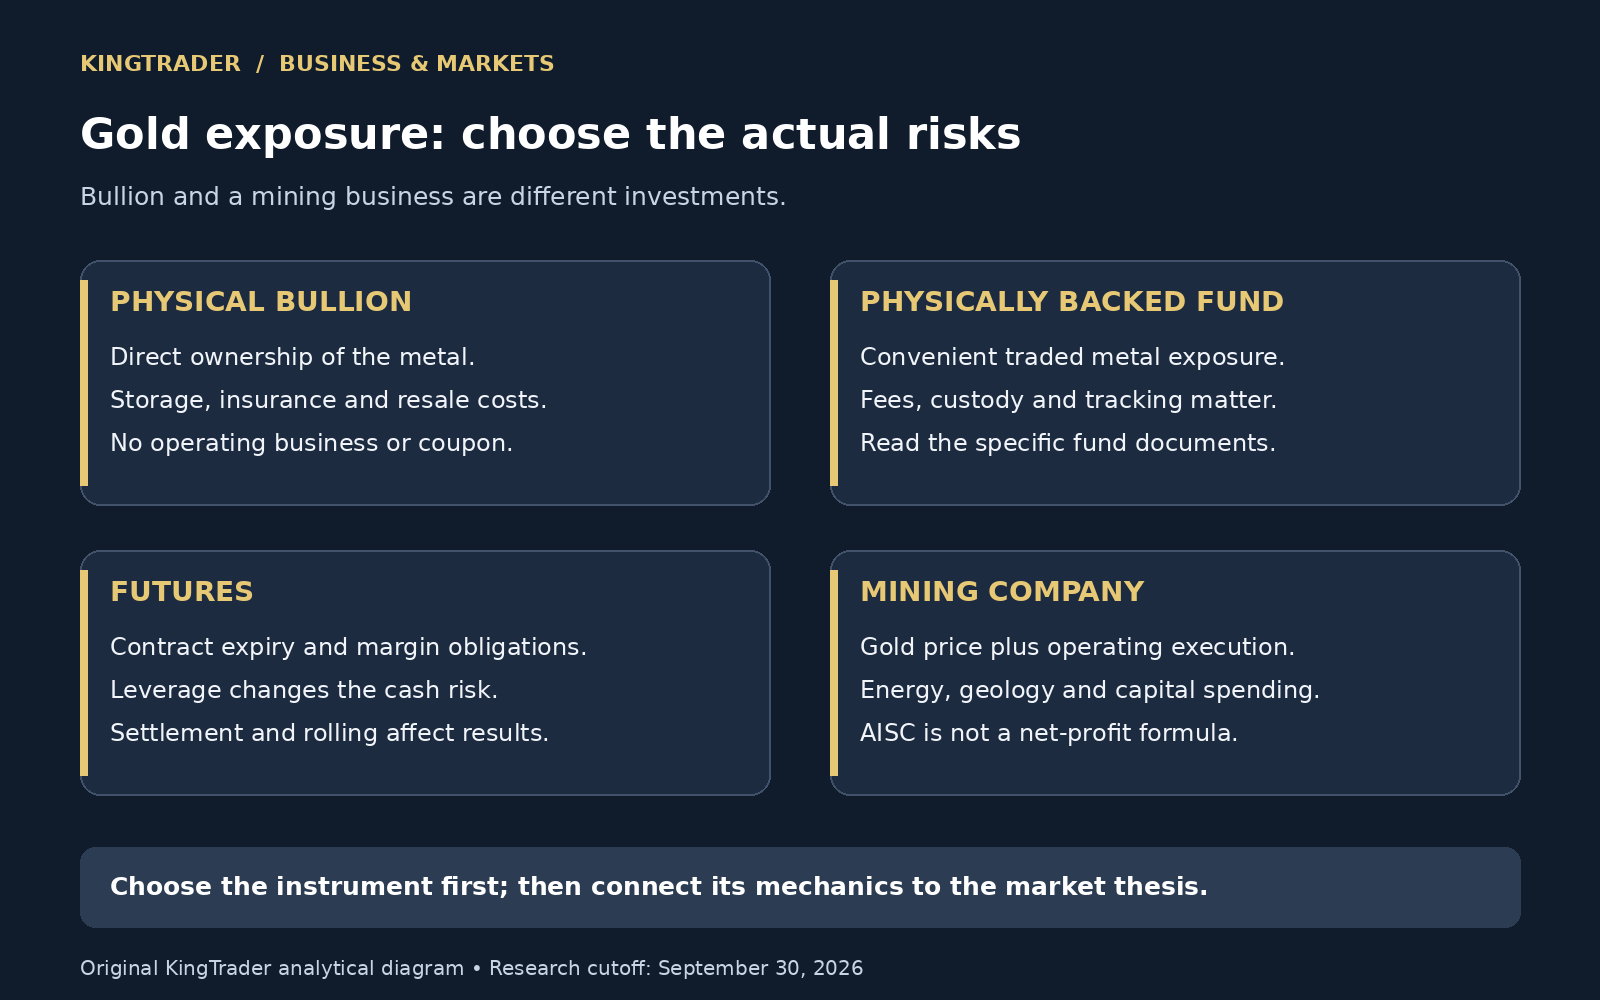
Build a scenario framework instead of a single price target
In a tightening scenario, real yields and the dollar remain firm while investor flows weaken. Gold may face pressure even if inflation headlines remain alarming. A miner can face an additional squeeze if energy costs rise at the same time.
In a confidence-shock scenario, investors prioritise liquidity, diversification or protection against financial instability. Gold can attract demand despite an unfavourable opportunity-cost backdrop. The question becomes whether that demand is broad and persistent or concentrated in a short burst of positioning.
In a disinflation scenario, both inflation expectations and nominal yields may fall. Their relative movement determines what happens to real yields. It is therefore incorrect to assume that lower inflation necessarily hurts gold or that lower nominal yields necessarily help it.
Use these scenarios to identify the evidence that would change the thesis. Check matched-date real-yield data, the dollar, fund flows and the actual instrument’s price. Avoid combining yesterday’s metal price with last month’s flow estimate and calling the result a live signal.
Practical questions before taking gold exposure
Is a physically backed fund the same as bullion?
It can offer convenient metal exposure, but fees, custody arrangements, tracking and trading spreads matter. Read the particular fund’s documentation. Physical ownership has its own storage, insurance and transaction costs.
Why are futures different?
Futures involve contract dates, margin and settlement rules. A leveraged position can require additional cash or be closed before a longer-term view has time to work. Rolling contracts also affects the result. These mechanics deserve analysis independent of the gold narrative.
What is the strongest analytical starting point?
State the intended exposure and horizon, then identify the driver and the evidence that would invalidate it. Gold’s appeal can be durable while a particular trade remains poorly priced. The better analysis connects inflation to policy, policy to real yields and flows, and those forces to the risks of the instrument actually being bought.





Leave a Reply