Base on Top of a Base Chart Pattern And Real Examples
During the latter stages of a bear market, a seemingly negative condition flags what may be aggressive new leadership in the new bull phase. I call this unusual case a “base on top of a base.”
What happens is that a powerful stock breaks out of its base and advances, but is unable to increase a normal 20% to 30% because the general market begins another leg down. The stock therefore pulls back in price and builds a second back-and-forth price consolidation area just on top of its previous base while the general market averages keep making new lows.
When the bearish phase in the overall market ends, as it always does at some point, this stock is apt to be one of the first to emerge at a new high en route to a huge gain. It’s like a spring that is being held down by the pressure of a heavy object. Once the object (in this case, a bear market) is removed, the spring is free to do what it wanted to do all along. This is another example of why it’s foolhardy to get upset and emotional with the market or lose your confidence. The next big race could be just a few months away.
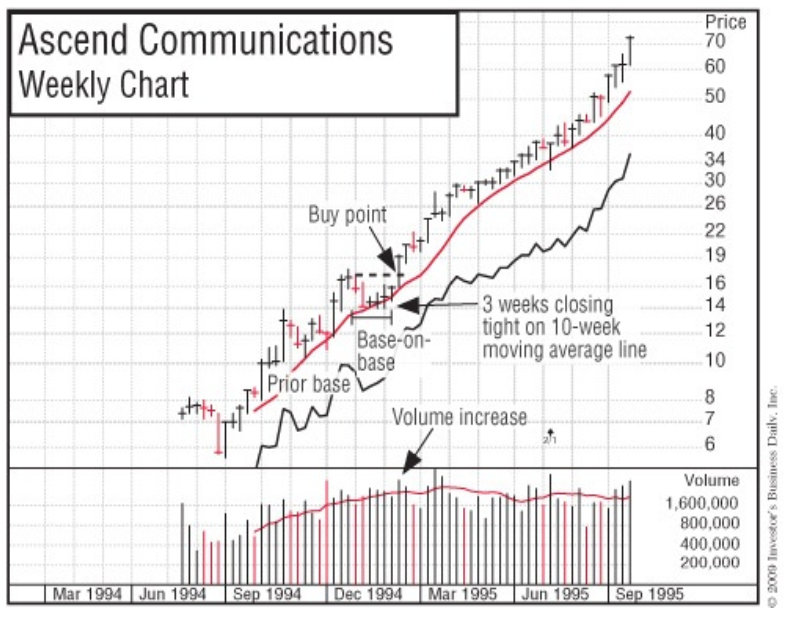
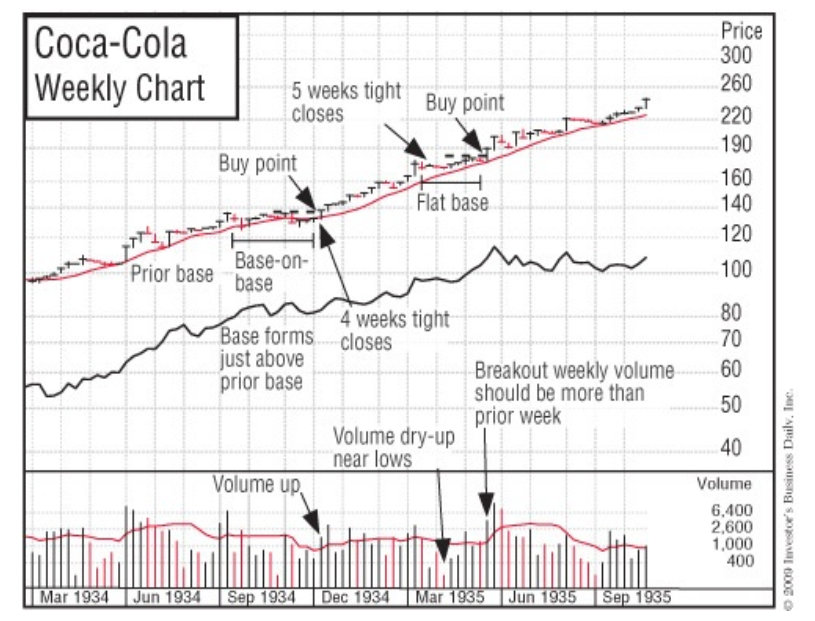
Two of our institutional services firm’s best ideas in 1978—M/A-Com and Boeing—showed base-on-top-of-a-base patterns. One advanced 180%, the other 950%. Ascend Communications and Oracle were other examples of a base on top of a base. After breaking out at the bear market bottom of December 1994, Ascend bolted almost 1,500% in 17 months. Oracle repeated the same base-on- base pattern in October 1999 and zoomed nearly 300%. Coming out of the Depression in 1934, Coca-Cola did the same thing.
Real Examples for Base on Top of a Base Chart Pattern


Leave a Reply