• HOME
  • TRADING ▼
    • ALL TRADING CANDLESTICK PATTERNS
  • STOCK ▼
    • BASIC STOCK KNOWLEDGE
    • DAY TRADING STRATEGIES
    • [UPDATED] BEST STOCKS TO BUY TOMORROW IN US CANADA
  • FOREX ▼
    • TRADING GOLD
    • FOREX KING TRADER FREE TRAINING
  • BUSINESS
  • SUPPORT
  • DOWNLOAD
    • 100+ Chart Patterns in Technical Analysis Download For Free [PDF| Printable]
    • A Complete Guide To Volume Price Analysis Summary [DOWNLOAD PDF]
  • TRADING COURSES
  • QUIZZES
    • Stock Trading Quizzes

Trading Strategy Library- KINGTRADER.NET

Trading Resource Download For Free!

Double Bottom Pattern and Double Bottom Chart in Stock Trading And Real Examples For Double Bottom Pattern

Double Bottom Pattern and Double Bottom Chart in Stock Trading And 30 Examples For Double Bottom Pattern

Recognizing a “Double-Bottom” Price Pattern

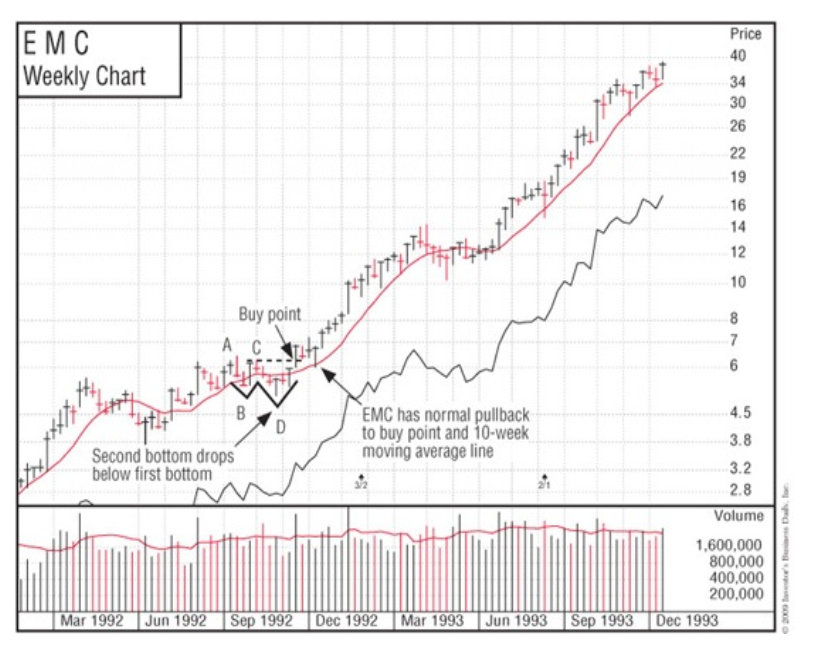
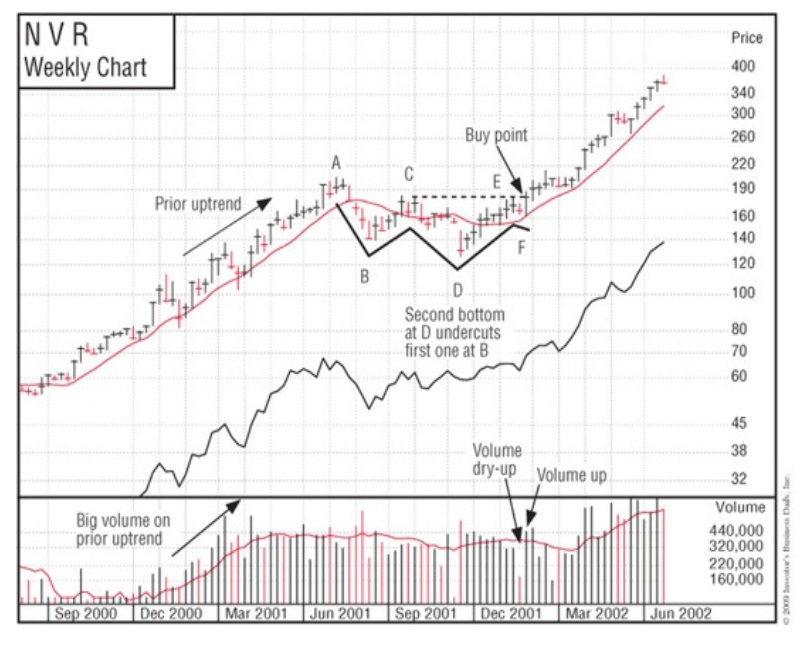
A “double-bottom” price pattern looks like the letter “W.” This pattern also doesn’t occur quite as often as the cup with handle, but it still occurs frequently. It is usually important that the second bottom of the W match the price level (low) of the first bottom or, as in almost all cases, clearly undercut it by one or two points, thereby creating a shakeout of weaker investors. Failure to undercut may create a faulty, more failure-prone “almost” double bottom. Double bottoms may also have handles, although this is not essential.
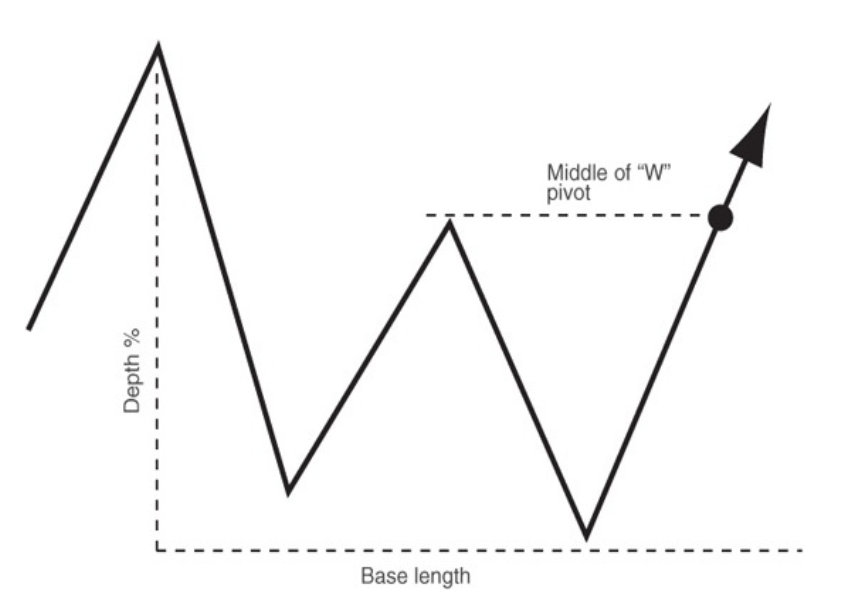
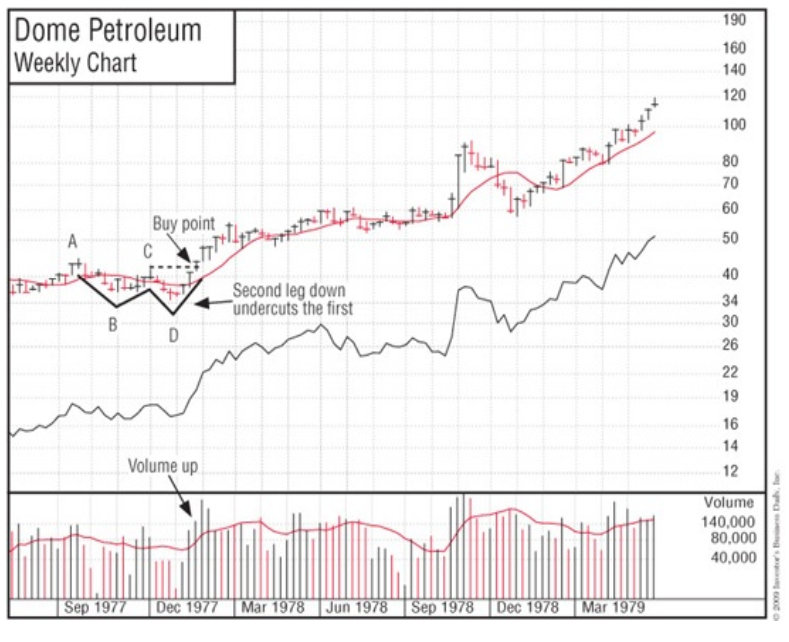
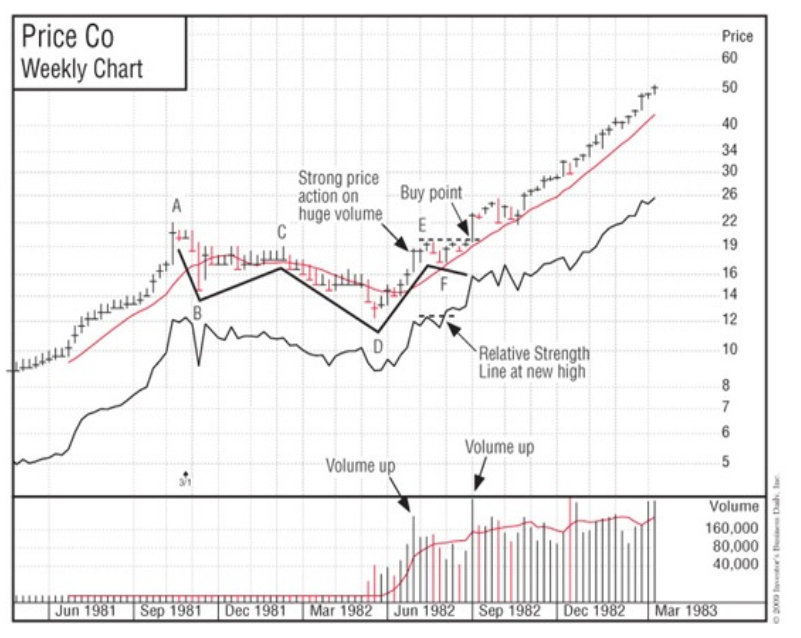
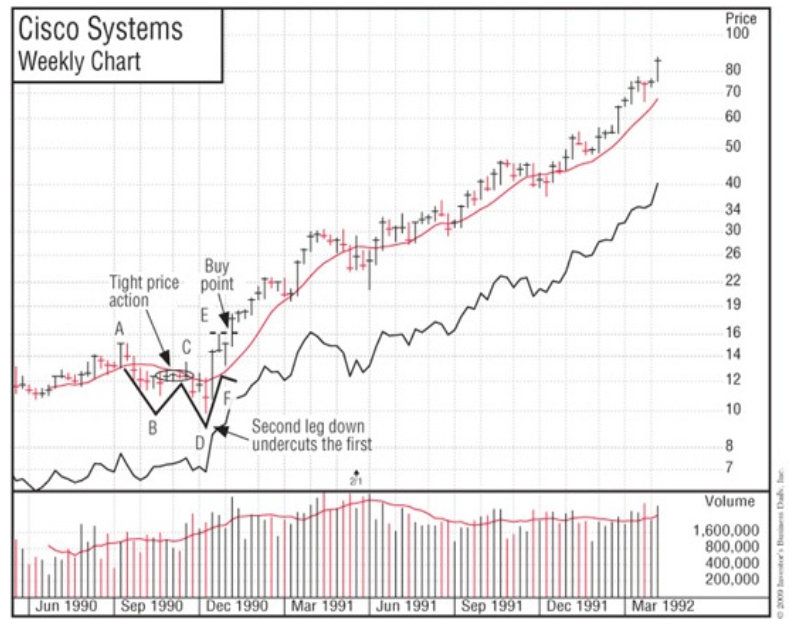
The depth and horizontal length of a double bottom are similar to those of the cup formation. The pivot buy point in a double bottom is located on the top right side of the W, where the stock is coming up after the second leg down. The pivot point should be equal in price to the top of the middle peak of the W, which should stop somewhere a little below the pattern’s peak price. If the double bottom has a handle, then the peak price of the handle determines the pivot buy point. See the accompanying charts for Dome Petroleum, Price Co. and Cisco Systems for outstanding examples of double-bottom price patterns found during 1977, 1982, and 1990. Some later examples are EMC, NVR, and eBay.
For double-bottom patterns, the following symbols apply: A = beginning of base; B = bottom of first leg; C = middle of W that sets the buy point; D = bottom of second leg. If the double-bottom pattern has a handle, then E = top of the handle (sets the buy point) and F = bottom of the handle.

Real Examples For Double Bottom Stock Pattern

How useful was this post?

Click on a star to rate it!

Average rating 5 / 5. Vote count: 88

No votes so far! Be the first to rate this post.

Related Posts:

  • The real meaning of Price Action TradingThe real meaning of Price Action Trading
  • Chart pattern quizChart pattern quiz
  • Lesson 3 Part 1 - Stock market Quiz questions: Basic principles of supply and demand in stock tradingLesson 3 Part 1 - Stock market Quiz questions: Basic…
  • Lesson 3 - part 2: Stock market quiz on Basic principles of supply and demand in stock tradingLesson 3 - part 2: Stock market quiz on Basic…
  • Lesson 1 P2-Learn stock trading for beginners from scratch with Quiz Questions : Understanding what stocks are and how they workLesson 1 P2-Learn stock trading for beginners from…
  • Lesson 1-Part 1: Learn stock trading for beginners from scratch with Quiz Questions: Understanding what stocks are and how they workLesson 1-Part 1: Learn stock trading for beginners…

Leave a Reply Cancel reply

Your email address will not be published. Required fields are marked *

Recent Posts

  • Top 50 Most Profitable Candlestick Patterns for Trading – Stocks, Forex, Options, and Cryptocurrency
  • What is a Candlestick?
  • What Day Trading is Not?
  • Key terms used in Technical Analysis
  • What is Technical analysis?

© Copyright 2020 - Best Sources For Stock, Forex And Options Traders