• HOME
  • TRADING ▼
    • STOCK ▼
      • BASIC STOCK KNOWLEDGE
      • DAY TRADING STRATEGIES
      • [UPDATED] BEST STOCKS TO BUY TOMORROW IN US CANADA
    • FOREX ▼
      • TRADING GOLD
      • FOREX KING TRADER FREE TRAINING
    • TRADING COURSES
    • ALL TRADING CANDLESTICK PATTERNS
  • BUSINESS
  • SUPPORT
  • DOWNLOAD
    • 100+ Chart Patterns in Technical Analysis Download For Free [PDF| Printable]
    • A Complete Guide To Volume Price Analysis Summary [DOWNLOAD PDF]
  • QUIZZES
    • Stock Trading Quizzes
  • APP

Trading Strategy Library- KINGTRADER.NET

Trading Resource Download For Free!

High Tight Flag Chart Pattern And Real Examples

High Tight Flag Chart Pattern And Real Examples

High, Tight Flags Are Rare

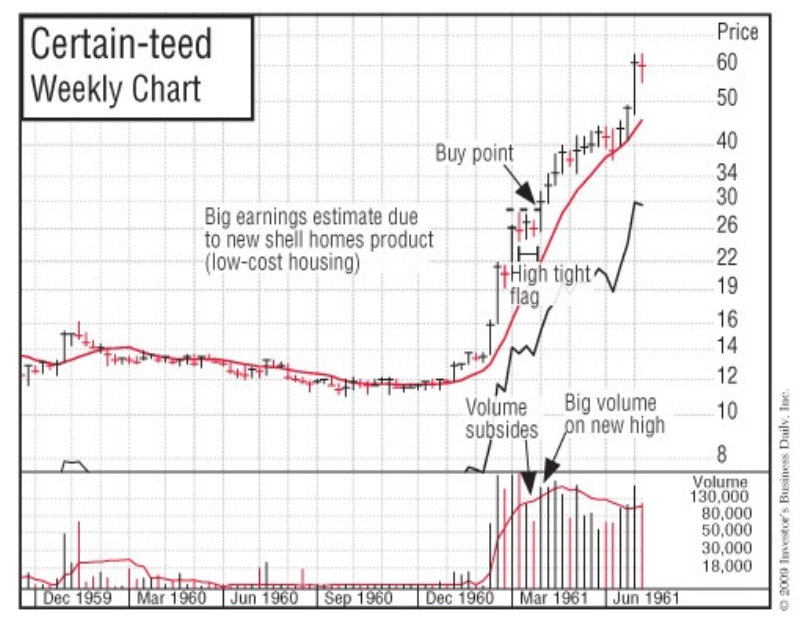
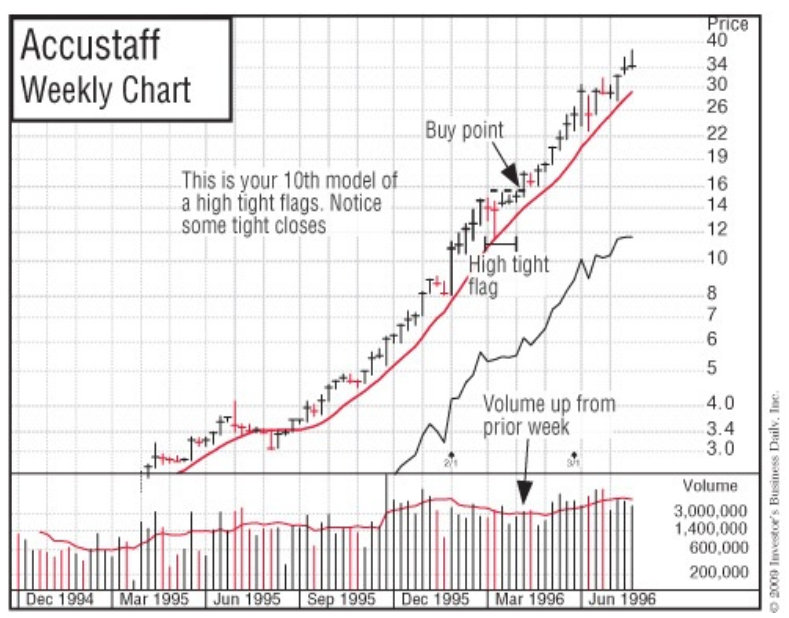
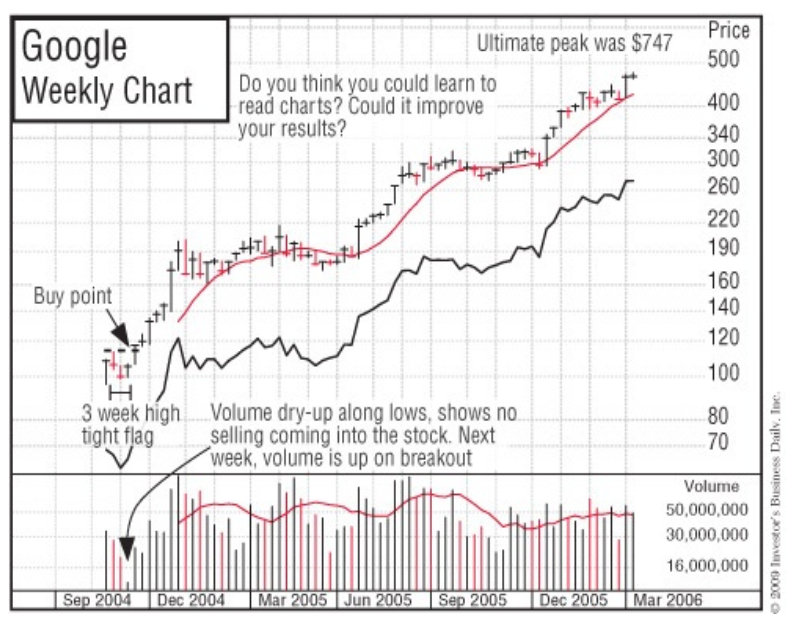
A “high, tight flag” price pattern is rare, occurring in no more than a few stocks during a bull market. It begins with the stock moving generally 100% to 120% in a very short period of time (four to eight weeks). It then corrects sideways no more than 10% to 25%, usually in three, four, or five weeks.

This is the strongest of patterns, but it’s also very risky and difficult to interpret correctly. Many stocks can skyrocket 200% or more off this formation. (See the charts for Bethlehem Steel, May 1915; American Chain & Cable, October 1935; E. L. Bruce, June 1958; Zenith, October 1958; Universal Controls, November 1958; Certain-teed, January 1961; Syntex, July 1963; Rollins, July 1964; Simmonds Precision, November 1965; Accustaff, January 1995; Emulex, October 1999; JDS Uniphase, October 1999; Qualcomm, December 1999; Taser International, November 2003; and Google, September 2004. Each earlier pattern serves as a precedent for each later pattern, so study them carefully.

The E. L. Bruce pattern in the second quarter of 1958, at around $50, provided a perfect chart pattern precedent for the Certain-teed advance that occurred in 1961. Certain-teed, in turn, became the chart model that I used to buy my first super winner, Syntex, in July 1963.

Real Examples For High Tight Flag Chart Pattern

How useful was this post?

Click on a star to rate it!

Average rating 4.6 / 5. Vote count: 10

No votes so far! Be the first to rate this post.

Related Posts:

  • The real meaning of Price Action TradingThe real meaning of Price Action Trading
  • Top 50 Most Profitable Candlestick Patterns for Trading – Stocks, Forex, Options, and CryptocurrencyTop 50 Most Profitable Candlestick Patterns for…

Leave a Reply Cancel reply

Your email address will not be published. Required fields are marked *

Recent Posts

  • Cashflow Game For Android (Multiplayer): Learn Money Management While Having Fun
  • Top 50 Most Profitable Candlestick Patterns for Trading – Stocks, Forex, Options, and Cryptocurrency
  • What is a Candlestick?
  • What Day Trading is Not?
  • Key terms used in Technical Analysis

© Copyright 2020 - Best Sources For Stock, Forex And Options Traders