PIVOT POINT SYSTEM FOR FOREX: TRADING TRIGGER STRATEGY
After a Down Trend – If the price closes above the moving average, and above prior time period’s highs, with a sequence of higher highs and higher lows, enter a long position since the uptrend is now confirmed. You will want the moving average to have formed a flat line or a higher sloping angle. Place a stop below the lowest low Point.
After a Up Trend -If the prices close below the moving average, and below prior time period’s lows, with a sequence of lower highs and lower lows, enter a short position, since the down trend is now confirmed. You will want the moving average to have formed a flat line or a lower sloping angle. Place a stop above the highest high Point.
If trades are based on the market direction number, or three period Pivot Point moving average, there is no need to wait for the value of the moving average to start rising or falling to determine the trigger to enter the market; a close above the moving average will trigger a long position and a close below the moving average will trigger a short position. However we want to see the moving average values follow the direction of the price move in the desired trade.
The conditional moving average system incorporates the Pivot Point moving average approach with another variable. This method combines two moving averages. The resulting system provides a powerful crossover trigger to enter the market as well as an indicator of the move’s strength with the slope or angle and the difference or separation of the moving average lines.
A crossover provides both the entry and the exit signal in addition to a set of rules or conditions. This system works on any time frame, 5 minutes and greater, in any high volume market. It is an excellent short-term trading method for highly liquid markets such as FOREX, certain Futures markets and Stocks that have ample trading volume.
There are other combinations one can use, such as a 5 Period Pivot Point Moving average of the Pivot Point with a two period simple moving average of a close. The reason why I test various time periods and variables for my parameter settings is due to the various conditions each market has. After all, Bonds move differently than S&P’s, or you may agree that FOREX currencies move differently than individual Stocks. The bottom line is this, I use the two moving average values to help me identify a shift in momentum of the market and then as the conditions change, such as a close above or below the values of both moving averages, I use the Pivot Point filtering method to help me identify a potential profit target.
For the purposes of this course, let me show you how to integrate the Pivot Point with the three period moving average of the Pivot Point. In the previous section, I disclosed how to filter the Pivot support and resistance levels by labeling the market condition as Neutral, Bullish or Bearish. We can also chart and track the conditional change of the market by plotting the directional change in the two moving average settings.
Figure 17, shows both moving average values declining but as the Pivot Point crosses above the three period moving averages, it alerts us that the internal market condition is changing to bullish.
Once both moving averages start to Point up and the Pivot Point is above the three period Pivot Point Average, the market conditions confirm we are in a bullish trend.
■ As a general rule, a trader would look to buy from an area of support in a market that is trending upwards (buy pullbacks).

The focus is that prices traded above both moving average values and the three period Pivot Point moving average acted as support all the way up. Both moving averages were moving in tandem with each other and the angle or slope of both averages was pointing in the direction of the trend.
This is an important point so let me reiterate: what helps indicate the strength of a trend is when we use two or more sets of values for our moving averages and also the following:
- The angle or slope of the Moving Averages is both pointing in the direction of the trend.
- The moving averages have a good degree of separation or are equidistant from each other, which indicate a steady trending condition.
- The moving averages are trending in tandem or parallel with each other rather than one out pacing the other.
- If the shorter term moving average separates or moves too far away from the longer term moving average; then you have a potential for an overbought condition and you should start looking to liquidate half of your positions.
- When a crossover occurs, liquidate the entire position.
In figure 18 let’s go over what the 15 minute chart on the spot FOREX Yen looks like with the COMAS™ method. If you look at the candle before 10 AM you will see the moving average values actually crossed over first, before the long white candle forms after 10 AM. This gives an early warning and indicates that there is a bullish bias. Keep in mind, it happened before the price action confirmed a bullish trend with the sequence of higher highs, higher lows and higher closing highs.

This feature allows you to have an early warning system in place that helps spot directional trend changes. Let’s look at figure 19 with the daily chart on the Spot FOREX British Pound. As you can see, the moving average crossover that occurs on November 25th foretells the bullish trend reversal that carries the market from the 1.71 level all the way up to the 1.77 area. In that trend run, you will see how the moving averages both lined up and acted as support. By the time December 15th rolled around, notice how the moving average crosses back down, giving you an early warning that the trend was in jeopardy, and sure enough, a bearish reversal occurred. From the peak in December, we see the market decline and the Pivot Point crossing beneath the three period Moving average; this not only indicated a bearish reversal, but also note that the three period Pivot Point acted as a resistance line all the way down as prices kept in sequence of lower highs lower lows and lower closing lows
There is one more element to that sequence, which is a dark candle representing the market closing below each time periods open. Keep that in mind when we go over candle patterns in the coming section.

As illustrated in Figure 20, the COMAS™ method works in helping to determine changes in market conditions from a consolidation phase to a bullish uptrending phase, and then back to a down trending or bearish condition phase. Figure 18 illustrates a bearish conditional change in the market once the Pivot Point crosses beneath the three period moving average Pivot Point. Once you have identified that a bearish condition exists; then you can trigger a short position.
■ As a general rule, a trader would look to se//from an area of resistance in a market that is trending to the downside (sell rallies).
In trading, as in life, timing is everything. There is nothing more frustrating to a trader than to correctly analyze the market, correctly predict the direction of the trend, get stopped out due to a premature entry, and watch the market launch in the predicted direction. As we all determine early in our trading careers, being correct about the direction of the trend is not enough. We must also be able to anticipate when the market is setting up to trigger an appropriate entry into the market. The Pivot Point combined with a moving average of the Pivot Point is one method worth utilizing in your trading approach that can help you successfully identify when a conditional change may occur in the market.
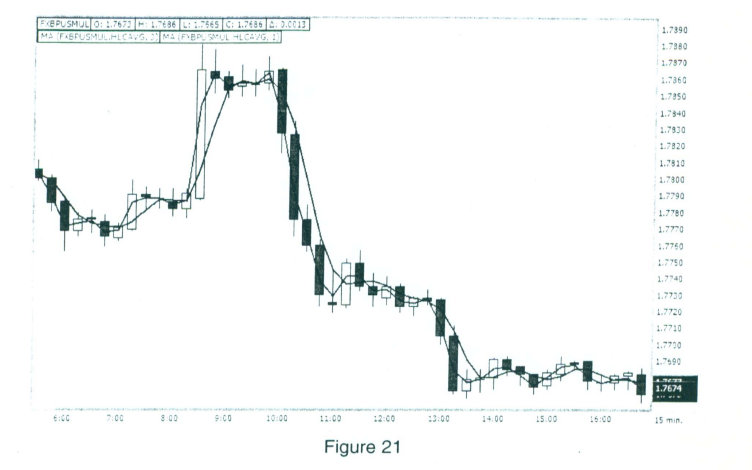
Let’s look at figure 21 which is a 15 minute chart on the Spot FOREX British Pound. Notice the consolidation period after the long white candle at approximately 9:00 AM; prices go in a sideways mode or consolidation phase. The moving averages also flat line with a bias towards a downward slope. The crossover occurs followed by a lower closing low, a lower high a lower low and the close is below the open. In addition, the price is closing beneath both moving average values and acts as resistance, all the way down, until the market moves into a consolidation phase.
The concept of incorporating Pivot Point analysis with a moving average approach will give you a testifiable, mechanical systematic approach to trading. In order to execute a trade, you need to have specific elements to occur. Knowledge of these elements will arm you with critical information that can help to prevent you from overtrading, as well as helping you avoid market and emotional pitfalls.
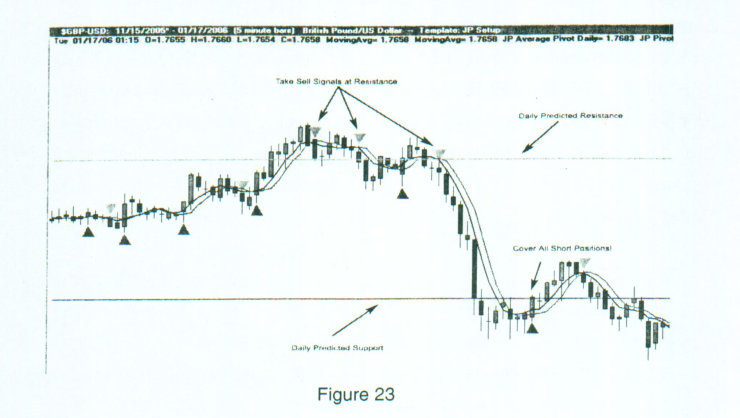
For starters, in order to execute a trade, you need to see a change in market direction and commitment from the market to illustrate a change in market direction by closing above or below the moving averages. Next, you need to follow some simple rules, such as taking buy signals at support and taking sell signals at resistance.
The importance of this trading method is that you must be able to apply the techniques on a consistent basis; this will allow you to make decisions in a mechanical and non-emotional way. A common mistake that traders make is that they do not test a strategy and make a logical determination if the strategy is viable for their trading style. Many traders adopt a new strategy, trade with it immediately and start tweaking different components of the strategy. Then they decide that there is no merit to the strategy since they are not profitable and begin looking for a different strategy.
A much better approach is to establish a defined set of trading rules and test those rules until a positive, outcome is determined, based on a reasonable number of trades. In order for you to be successful as a trader, you can not anticipate an outcome; you must develop the patience to wait for your triggers and you must also develop the discipline to follow through with that trigger. These character traits can be learned and developed by implementing this methodology. It is what I teach students and other highly successful professional traders.
When the price target has been met and the trigger has presented itself, enter the trade without hesitation. Do not think about the entry, this should be a mechanical process. You have already done your homework and you have satisfied your criteria. Your system is in place and this is part of the system. If you do not place the trade when the trigger executes and confirms, you are not trading according to your plan.
Successful traders have the courage to act and act promptly. It is important to recognize the immediate environment or market condition. Is it up, down or sideways?
Let’s say a bullish trend is established; it should consist of higher highs, higher lows, and each period should close above the open, and we should see higher closing highs. The Pivot Point Moving average should help verify this condition. In a bearish trend we would want to see lower highs, lower lows, each period should close below the open, and we should see lower closing lows. Under these circumstances the Pivot Point moving average should confirm this market condition as well.
First of all, traders need to identify themselves; this will help you follow what time frame to follow in a trending market. Are you a day trader, or are you a swing trader that may be in a position that lasts two to five days, or are you a position trader? Once we acknowledge what our time objective is, we can narrow down what our goals and what our expectations for the trade might be. For example when I am day trading, I will generally be able to identify what the average range for a day is and expect that if I miss 20% of the bottom and 20% of the top, while waiting for a moving average crossover signal, then I can expect to only capture 60% of the average daily range.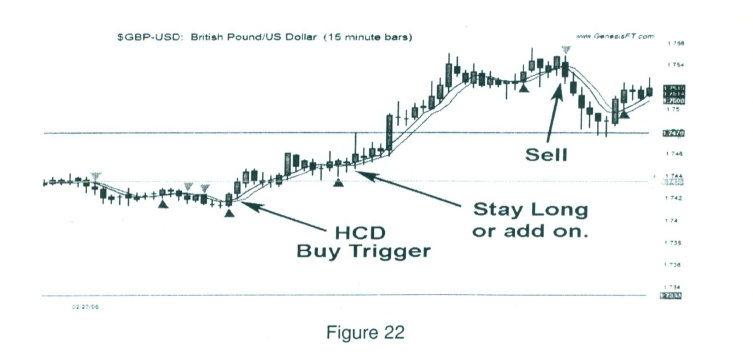
HOW DO I START
First, I need to structure my computer and charts to a format that is conducive for day trading. In spot FOREX I use the Euro and a “like” market such as the British Pound and the Yen.
For day trading, I use I use the 5 and 15 minute time periods. All of my chart screens look the same with the 5 minute on the top and the and 15 minute on the bottom. All my chart pages are set up this way, therefore all chart pages are synchronized so I do not watch or confuse a different time period when switching from one screen to another; I have a uniform setting.
■ I find the most reliable day trade signals are confirmed in the 15 minute time frame and triggered in the 5 minute time period.
■ When both time frames are in sync with each other, and “like” markets have similar signals, this generates a higher probability trigger.
As I stated earlier, the parameters I use in this course are a variation of what is programmed in my proprietary library with genesis software. This is a system that generates buy and sell signals based on the principles we have gone over so far.
The greatest feature with this software is that it highlights a sell signal with a red triangle pointing down and it signals when the trigger occurs to buy with a green triangle pointing up. These coincide against resistance levels to sell and support levels to buy. As you can see, the sell signals, when aligned up against the Pivot Point resistance numbers, offer a fantastic visual confirmation based on my predefined strategies, therefore it will help eliminate the emotional element and impatience of acting on anticipation rather than acting on a true signal. All the signals and methods covered in this course can be applied with most charting packages.
In fact, twenty six years ago I was calculating the Pivot Point support and resistance numbers with a hand held calculator. I have a Pivot Point calculator that is available to members and all that needs to be done is input the data for the high, the low and the close and the R-2 down to the S-2 numbers will be calculated for you. It is very Easy to use; all you need are the prices for the FOREX markets for any time frame.


Leave a Reply