• HOME
  • TRADING ▼
    • STOCK ▼
      • BASIC STOCK KNOWLEDGE
      • DAY TRADING STRATEGIES
      • [UPDATED] BEST STOCKS TO BUY TOMORROW IN US CANADA
    • FOREX ▼
      • TRADING GOLD
      • FOREX KING TRADER FREE TRAINING
    • TRADING COURSES
    • ALL TRADING CANDLESTICK PATTERNS
  • BUSINESS
  • SUPPORT
  • DOWNLOAD
    • 100+ Chart Patterns in Technical Analysis Download For Free [PDF| Printable]
    • A Complete Guide To Volume Price Analysis Summary [DOWNLOAD PDF]
  • QUIZZES
    • Stock Trading Quizzes
  • APP

Trading Strategy Library- KINGTRADER.NET

Trading Resource Download For Free!

Square Box Chart Pattern And Real Examples

Square Box Chart Pattern And Real Examples

Here’s a New Base We’ve Dubbed a Square Box

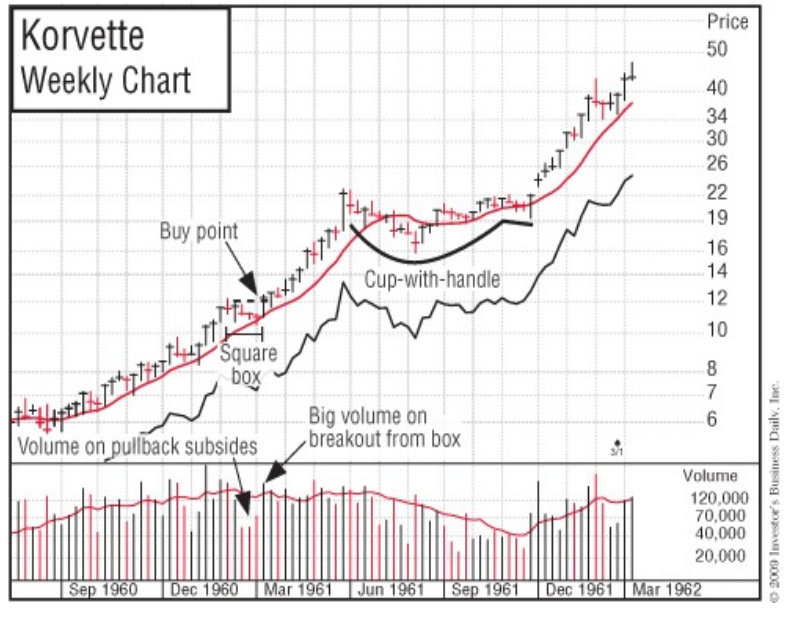
After moving up from a cup with handle or double bottom, this formation typically lasts from four to seven weeks; doesn’t correct too much, usually only 10% to 15%; and has a square, boxy look. I’ve noted this over recent years, but finally we’ve studied, measured, and classified it. Here are some examples: Lorillard, Korvette, Texas Instruments, Home Depot, Dell, and Taro.

Real Examples For Square Box Chart Pattern 

How useful was this post?

Click on a star to rate it!

Average rating 5 / 5. Vote count: 56

No votes so far! Be the first to rate this post.

Related Posts:

  • The real meaning of Price Action TradingThe real meaning of Price Action Trading
  • Top 50 Most Profitable Candlestick Patterns for Trading – Stocks, Forex, Options, and CryptocurrencyTop 50 Most Profitable Candlestick Patterns for…

Leave a Reply Cancel reply

Your email address will not be published. Required fields are marked *

Recent Posts

  • Cashflow Game For Android (Multiplayer): Learn Money Management While Having Fun
  • Top 50 Most Profitable Candlestick Patterns for Trading – Stocks, Forex, Options, and Cryptocurrency
  • What is a Candlestick?
  • What Day Trading is Not?
  • Key terms used in Technical Analysis

© Copyright 2020 - Best Sources For Stock, Forex And Options Traders