The Most Common Chart Pattern: “Cup And Handle Stock Chart”
One of the most important price patterns looks like a cup with a handle when the outline of the cup is viewed from the side. Cup patterns can last from 7 weeks to as long as 65 weeks, but most of them last for three to six months. The usual correction from the absolute peak (the top of the cup) to the low point (the bottom of the cup) of this price pattern varies from around the 12% to 15% range to upwards of 33%. A strong price pattern of any type should always have a clear and definite price uptrend prior to the beginning of its base pattern. You should look for at least a 30% increase in price in the prior uptrend, together with improving relative strength and a very substantial increase in trading volume at some points in the prior uptrend.
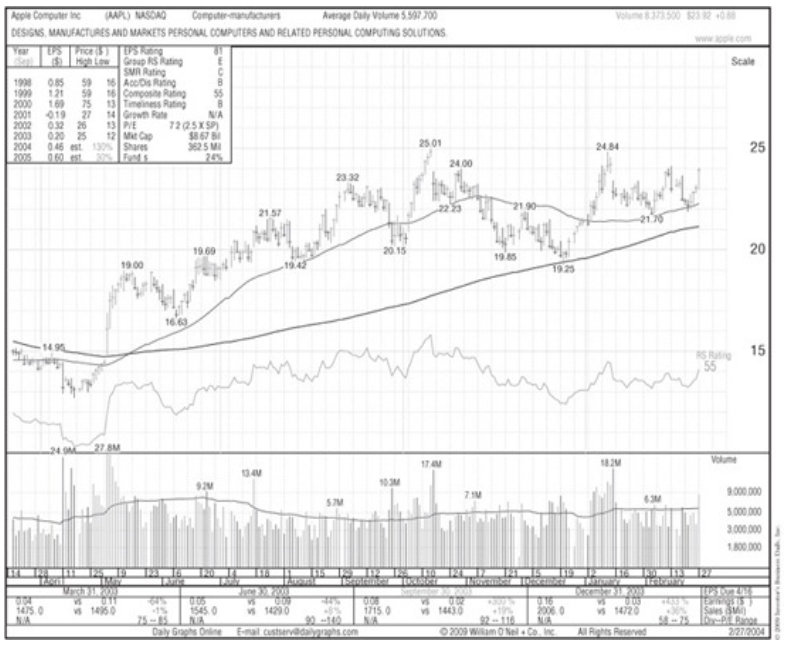
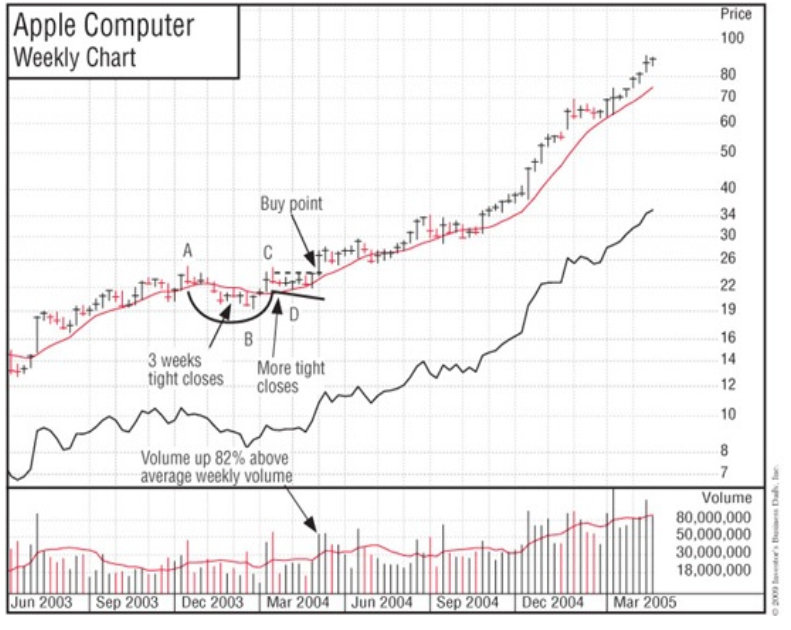
In most, but not all, cases, the bottom part of the cup should be rounded and give the appearance of a “U” rather than a very narrow “V.” This characteristic allows the stock time to proceed through a needed natural correction, with two or three final little weak spells around the lows of the cup. The “U” area is important because it scares out or wears out the remaining weak holders and takes other speculators’ attention away from the stock. A more solid foundation of strong owners who are much less apt to sell during the next advance is thereby established. The accompanying chart from Daily Graphs Online® shows the daily price and volume movements for Apple Computer in February 2004.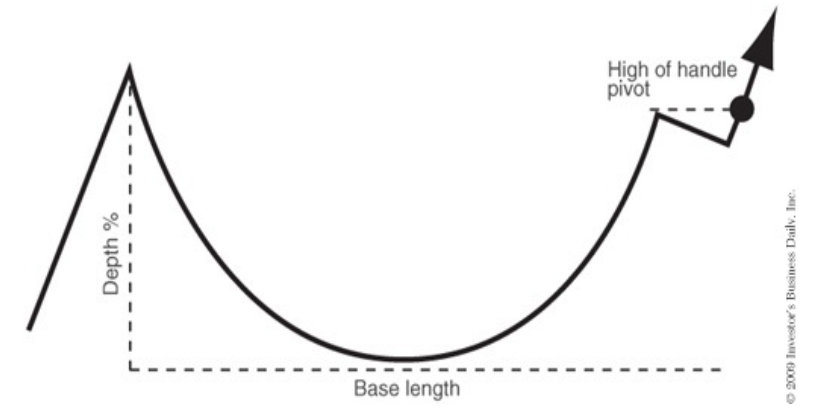
It’s normal for growth stocks to create cup patterns during intermediate declines in the general market and to correct 1^ to 2^ times the market averages. Your best choices are generally stocks with base patterns that deteriorate the least during an intermediate market decline. Whether you’re in a bull market or a bear market, stock downturns that exceed 2^ times the market averages are usually too wide and loose and must be regarded with suspicion. Dozens of former high-tech leaders, such as JDS Uniphase, formed wide, loose, and deep cup patterns in the second and third quarters of 2000. These were almost all faulty, failure-prone patterns signaling that the stocks should have been avoided when they attempted to break out to new highs.
A very small number of volatile leaders can plunge by as much as 40% or 50% in a bull market. Chart patterns that correct by more than this amount
during bull markets have a higher rate of failure if they try to make new price highs and resume their advance. The reason? A downswing of over 50% from a peak to a low means that the stock must increase more than 100% from its low to get back to its old high. Historical research has shown that stocks that make new price highs after such huge moves tend to fail 5% to 15% beyond their breakout prices. Stocks that come straight off the bottom into new highs off cups can be more risky because they had no pullbacks.
Sea Containers was a glowing exception. It descended about 50% during an intermediate decline in the 1975 bull market. It then formed a perfectly shaped cup-with-handle price structure and proceeded to increase 554% in the next 101 weeks. This stock, with its 54% earnings growth rate and its latest quarterly results up 192%, was one of several classic cup-with-handle stocks that I presented to Fidelity Research & Management in Boston during a monthly meeting in early June 1975. Upon seeing such big numbers, one of the portfolio managers was instantly interested.
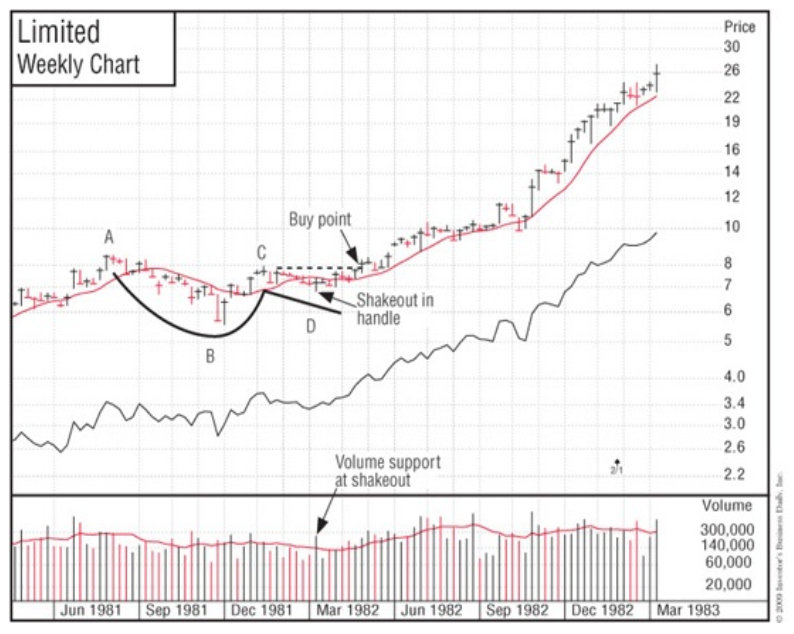
As you can see by this example, some patterns that have corrected 50% to 60% or more coming out of an intermediate bull market decline or a major bear market can succeed. (See the charts for Sea Containers and The Limited.) In these cases, the percent of decline is a function of the severity of the general market decline and the tremendous extent of the stock’s prior price run-up.
Basic Characteristics of a Cup’s Handle Area
The formation of the handle area generally takes more than one or two weeks and has a downward price drift or “shakeout” (where the price drops below a prior low point in the handle made a few weeks earlier), usually near the end of its down-drifting price movement. Volume may dry up noticeably near the lows in the handle’s price pullback phase. During a bull market, volume in the majority of cases should not pick up during a correction in the handle, although there have been some exceptions.
Although cups without handles have a somewhat higher failure rate, many stocks can advance successfully without forming a handle. Also, some of the more volatile technology names in 1999 formed handles of only one or two weeks before they began their major price advances.
When handles do occur, they almost always form in the upper half of the overall base structure, as measured from the absolute peak of the entire base to the absolute low of the cup. The handle should also be above the stock’s 10- week moving average price line. Handles that form in the lower half of an overall base or completely below the stock’s 10-week line are weak and failure- prone. Demand up to that point has not been strong enough to enable the stock to recover more than half its prior decline.
Additionally, handles that consistently wedge up (drift upward along their price lows or just go straight sideways along their lows rather than drifting down) have a much higher probability of failing when they break out to new highs. This upward-wedging behavior along low points in the handle doesn’t let the stock undergo the needed shakeout or sharp price pullback after having advanced from the low of the base into the upper half of the pattern. This high¬risk trait tends to occur in third-or fourth-stage bases, in laggard stock bases, or in very active market leaders that become too widely followed and therefore too obvious. You should beware of wedging handles.
A price drop in a proper handle should be contained within 8% to 12% of its peak during bull markets unless the stock forms a very large cup, as in the rather unusual case of Sea Containers in 1975. Downturns in handles that exceed this percentage during bull markets look wide and erratic and in most cases are improper and risky. However, if you’re in the last shakeout area of a bear market bottom, the unusual general market weakness will cause some handle areas to quickly decline around 20% to 30%, but the price pattern can still be sound if the general market then follows through on the upside, creating a new major uptrend. (. “M = Market Direction.”)
Constructive Patterns Have Tight Price Areas
There should also be at least some tight areas in the price patterns of stocks under accumulation. On a weekly chart, tightness is defined as small price variations from high to low for the week, with several consecutive weeks’ prices closing unchanged or remarkably near the previous week’s close. If the base pattern has a wide spread between the week’s high and low points every week, it’s been constantly in the market’s eye and frequently will not succeed when it breaks out. However, amateur chartists typically will not notice the difference, and the stock can run up 5% to 15%, drawing in less-discriminating traders, before it breaks badly and fails.
Find Pivot Points and Watch “Volume Percent Change”
When a stock forms a proper cup-with-handle chart pattern and then charges through an upside buy point, which Jesse Livermore referred to as the “pivot point” or “line of least resistance,” the day’s volume should increase at least 40% to 50% above normal. During major breakouts, it’s not uncommon for new market leaders to show volume spikes 200%, 500%, or 1,000% greater than the average daily volume. In almost all cases, it’s professional institutional buying that causes the big, above-average volume increases in the better-priced, better- quality growth-oriented stocks at pivot breakouts. A full 95 percent of the general public is usually afraid to buy at such points because it’s scary and it seems risky and rather absurd to buy stocks at their highest prices.
Your objective isn’t to buy at the cheapest price or near the low, but to begin buying at exactly the right time, when your chances for success are greatest. This means that you have to learn to wait for a stock to move up and trade at your buy point before you make an initial commitment. If you work and cannot watch the market constantly, small quote devices or quotes available on cell phones and Web sites will help you stay on top of potential breakout points.
The winning individual investor waits to buy at these precise pivot points. This is where the real move generally starts and all the exciting action begins. If you try to buy before this point, you may be premature. In many cases the stock will never get to its breakout point, but rather will stall or actually decrease in price. You want a stock to prove its strength to you before you invest in it. Also, if you buy at more than 5% to 10% past the precise buy point, you are buying late and will more than likely get caught in the next price correction. Your automatic 8% loss-cutting rule will then force you to sell because the stock was extended in price and didn’t have enough room to go through a perfectly normal sharp but minor correction. So don’t get into the bad habit of chasing stocks up too high.
Pivot buy points in correct chart base patterns are not typically based on a stock’s old high price. Most of them occur at 5% to 10% below the prior peak. The peak price in the handle area is what determines most buy points, and this is almost always somewhat below the base’s actual high. This is very important to remember. If you wait for an actual new high price, you will often buy too late. Sometimes you can get a slight head start by drawing a downtrend line from the overall pattern’s absolute peak downward across the peak where the stock begins building the handle. Then begin your purchase when the trend line is broken on the upside a few weeks later. However, you have to be right in your chart and stock analysis to get away with this.
Look for Volume Dry-Ups Near the Lows of a Price Pattern
Nearly all proper bases will show a dramatic drying up of volume for one or two weeks along the very low of the base pattern and in the low area or few last weeks of the handle. This means that all of the selling has been exhausted and there is very little stock coming into the marketplace. Healthy stocks that are under accumulation almost always show this symptom. The combination of tightness in prices (daily or weekly price closes being very near each other) and dried-up volume at key points is generally quite constructive.
Big Volume Clues Are Valuable
Another clue that is valuable to the trained chart specialist is the occurrence of big daily and weekly volume spikes. Microsoft is an example of an outstanding stock that flashed heavy accumulation just before a huge run-up.
Weeks of advancing prices on heavy volume, followed in other weeks by extreme volume dry-ups, are also a very constructive sign. If you use a Daily.
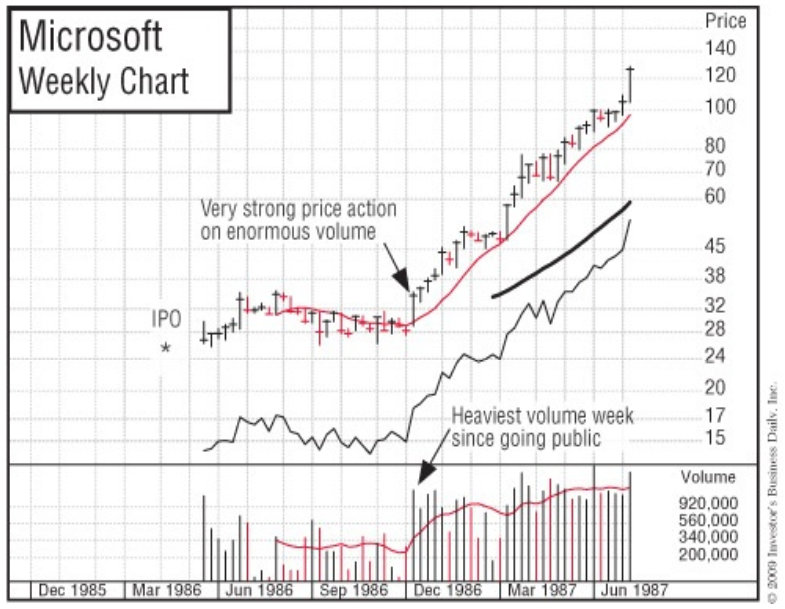
Graphs Online chart service in conjunction with the weekly graphs, you’ll be able to see unusual trading activity that sometimes happens on only one day. The day Microsoft broke out at its 31^2 buy point, its volume was 545% above average, signaling really important institutional buying. It then had a 13-year bull run from a split-adjusted 10 cents to $53.98. How’s that for a big percentage move?
Volume is a remarkable subject that is worthy of careful study. It can help you recognize whether a stock is under accumulation (institutional buying) or distribution (institutional selling). Once you acquire this skill, you won’t have to rely on the personal opinions of analysts and supposed experts. Big volume at certain key points is indispensable.
Volume is your best measure of supply and demand and institutional sponsorship—two vital ingredients in successful stock analysis. Learn how to use charts to time your purchases correctly. Making buys at the wrong time or, worse, buying stocks that are not under accumulation or that have unsound, faulty price patterns is simply too costly.
The next time you consider buying a stock, check its weekly volume. It’s usually a constructive sign when the number of weeks that the stock closes up in price on above-average weekly volume outnumbers the number of weeks that it closes down in price on above-average volume while still in its chart base.
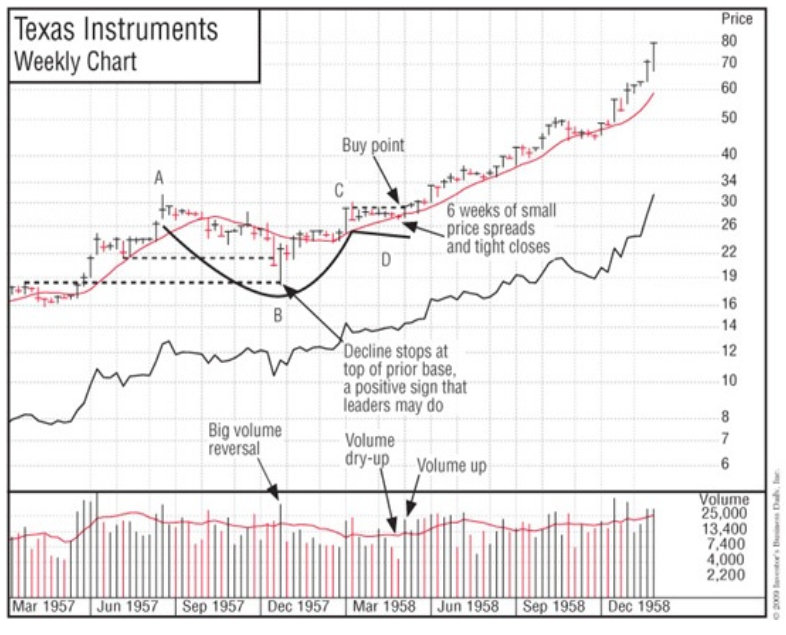
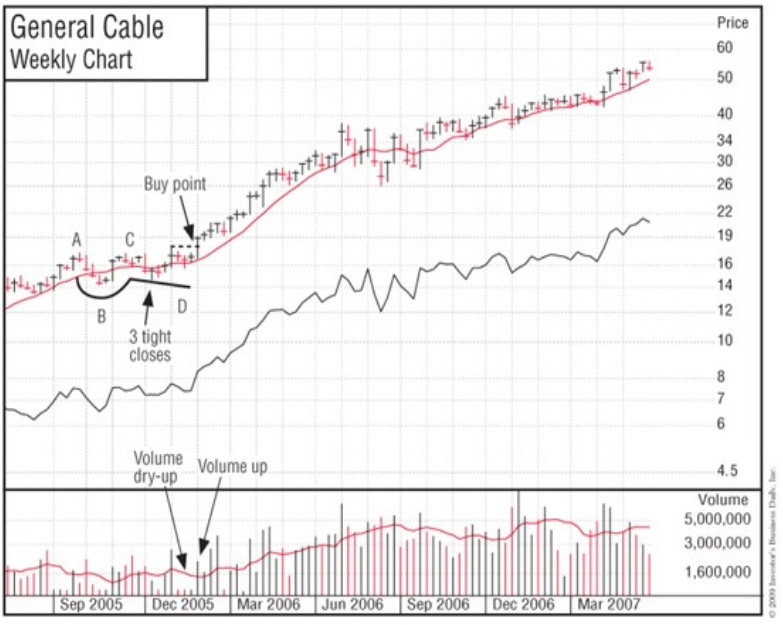
A Few Normal-Size Cups with Handles
Texas Instruments, Apple, General Cable, and Precision Castparts were all similar-size patterns in length and depth. Can you recognize the similarity between Apple and Precision Castparts? As you learn to do this with greater skill, you will in the future be able to spot many cup with handles just like these past winners.

The Value of Market Corrections
Since 80% to 90% percent of price patterns are created during periods of market corrections, you should never get discouraged and give up on the stock market’s potential during intermediate-term sell-offs or short or prolonged bear markets. America always comes back because of its inventors and entrepreneurs and the total freedom and unlimited opportunity that do not exist in communist or dictator-controlled countries.
Bear markets can last as little as three, six, or nine months or as long as two or, in very rare cases, three years. If you follow the sell rules in this book carefully, you will sell and nail down most of your profits, cut short any losses, raise significant cash, and move off margin (borrowed money) in the early stages of each new bear market (see the success stories at the end of the book).
In fact, Investor’s Business Daily conducted four surveys in late 2008 that indicated that about 60% of IBD subscribers used our rules to sell and raise cash in December 2007 or June 2008 and thereby preserved most of their capital prior to the more serious decline in late 2008 that resulted from the subprime loan debacle.
Even if you sell out completely and move to cash, you never want to throw in the towel on stock investing because bear markets create new bases in new stocks, some of which could be the next cycle’s 1,000% winners. You don’t foolishly give up while the greatest opportunities of a lifetime are setting up and may sooner or later be just around the corner.
A bear market is the time to do a postanalysis of your prior decisions. Plot on daily or weekly charts exactly where you bought and sold all the stocks you traded in the past year. Study your decisions and write out some new rules that will let you avoid the mistakes you made in the past cycle. Then study several of the biggest winners that you missed or mishandled. Develop some rules to make sure that you buy the real leaders and handle them right in the next bull market cycle. They will be there, and this is the time to be watching for them as they begin to form bases. The question is whether you will be there with a carefully thought-through game plan to totally capitalize on them.

HI, I LIKE THE CUP BOTTOM-TOP, OR CONTINUATION, SYM TRI,ASC-DESC TRI, FOR THAT MATTER ALL TECHNICAL CHART PATTERN. HOWEVER, I HAVE NOT BEEN ABLE TO FIND A SERVICE THAT SPECIALIZES IN WHAT I CONSIDER THE FIVE MAJOR CHART PATTERNS. IN JUNE OF 1988 I ATTENDED A WEEK LONG ONE ON ONE SEMINAR WITH GEORGE LANE AT HIS OFFICES IN CHICAGO, (SCHAUMBERG). AS YOU KNOW HE IS THE FATHER OF STOCASTICS. OVER THE YEARS THE COSTLY MISTAKES I MADE WAS DAY TRADING. NOW, I AM TRYING TO FOCUS ON FIVE SIMPLE PATTERNS. THE MOST RECENT “CUP” IS “X” THAT I HAVE TAKEN A POSITION AT $ 24, THE UPSIDE NEXT IS $32,THEN $ 40, THEN UP TO $ 48. OVER THE YEARS THE DATA SUBSCRITIONS I SUBSCRIBED TO HAD COLLASAL CHART VOLUMES, AND SCANNING THRU THEM ONE BY ONE IS TOOO MUCH TO FIND THE JEWELS. TODAY I AM SUBSCRIBED TO STOCK CHARTS AND REQUESTED HELP IN SETTING UP A “CUP” “CHART” SEARCH. BUT TO NO AVAIL. CHART SCHOOL THEY EMAIL BACK. WELL I HAVE NOT BEEN ABLE TO PROGRAM REGARDLESS HOW OFTEN I TRIED.
DO YOU HAVE A CHART SERVICE SPECIALIZING IN PATTERNS?
JUST WONDERING, SOMEONE OUT THERE HAS IT. COULD IT BE YOU?
HAPPY EASTER HUNT, THANKS FOR THE CUP CHARTS, JOHN M. LONG