Research cutoff: September 30, 2026. Company announcements and forecasts retain their original dates.

Copper is an unusually tempting investment story: electricity demand is expanding, grids need upgrading and new mines are difficult to build. That combination makes a structural shortage plausible. It does not make every copper trade profitable. Prices can move ahead of demand, inventories can shift between regions without being consumed, and mining shares can fall even while the metal becomes more valuable.
Copper trading in 2026 requires separating three questions. Is the world short of metal today? Could it be short several years from now? And how much of that future shortage is already priced into the instrument being bought? A good answer to the second question does not settle the first or third. This analysis uses information available on September 30 and focuses on the mechanics behind the market narrative.
The structural argument is credible, but conditional
The IEA’s May 2025 Global Critical Minerals Outlook identified a potential 30% copper supply shortfall by 2035 based on its mine project pipeline and projected demand. The report highlighted declining ore grades, capital costs and long development timelines. This is a conditional planning gap, not a claim that precisely 30% of copper will be unavailable or that prices must rise by a corresponding amount. The underlying IEA assessment is worth reading before using the figure in a trade.
The demand story is broader than AI. Grid investment, industrial equipment, buildings and electrification all matter. In the same report, the IEA identified China’s grid investment as the largest contributor to recent copper demand growth. A market participant who watches only data-centre announcements can miss weakness elsewhere. A narrow growth segment can be strong while the overall cycle slows.
Supply is not static either. Higher prices can encourage brownfield expansion, recycling, substitution and investment in new recovery methods. These responses take time and have technical limits, but they are part of the mechanism by which a market adjusts. The forecast gap is a reason to study supply economics, rather than an excuse to ignore them.
The core problem: different clocks drive the same price
A mine investment runs on a multi-year clock. Purchasing managers often run on a quarterly clock. Futures traders may run on a daily clock. A copper price contains expectations from all three. When a short-term slowdown meets a long-term supply constraint, price action can look contradictory without either side being irrational.
For example, a manufacturer can cut near-term orders to use existing inventory even while planning a larger factory. That reduces current demand for new metal without changing the long-term expansion plan. A miner can announce future capacity while being unable to deliver more tonnes this month. Current tightness and future relief can coexist.
The physical balance therefore needs more than a headline price. Examine mine disruptions, refinery output, exchange inventory, off-exchange stocks where data are credible, regional premiums and delivery timing. No single indicator captures the whole system. An exchange stock decline may reflect withdrawal into another warehouse rather than final industrial consumption.
Freeport: stronger prices can coexist with weaker production
Reuters reported on July 23, 2026 that Freeport-McMoRan’s second-quarter profit exceeded expectations as higher copper prices helped offset lower output linked to repairs at Grasberg. Its report said copper production was 18.2% lower year on year, while average copper prices were 41.5% higher. This is a useful example of opposing price and volume effects, not proof that mine disruption is harmless. Freeport’s own results announcement directs readers to its investor reporting for the full operating details.
The lesson is to build revenue from realised price and saleable volume separately. A higher benchmark does not repair a mine or pay for unexpected remediation without reducing other cash available to shareholders. Investors should examine production guidance, the restart path, capital spending and the treatment of insurance or exceptional items before comparing headline earnings across periods.
Revenue also differs from cash. Metal can be produced before it is sold; receivables can be collected later; capital spending may rise during recovery. A quarterly profit number can improve while free cash flow remains under pressure. The question is how much of the price benefit survives operating costs, taxes and reinvestment.
A simple mining margin stress test
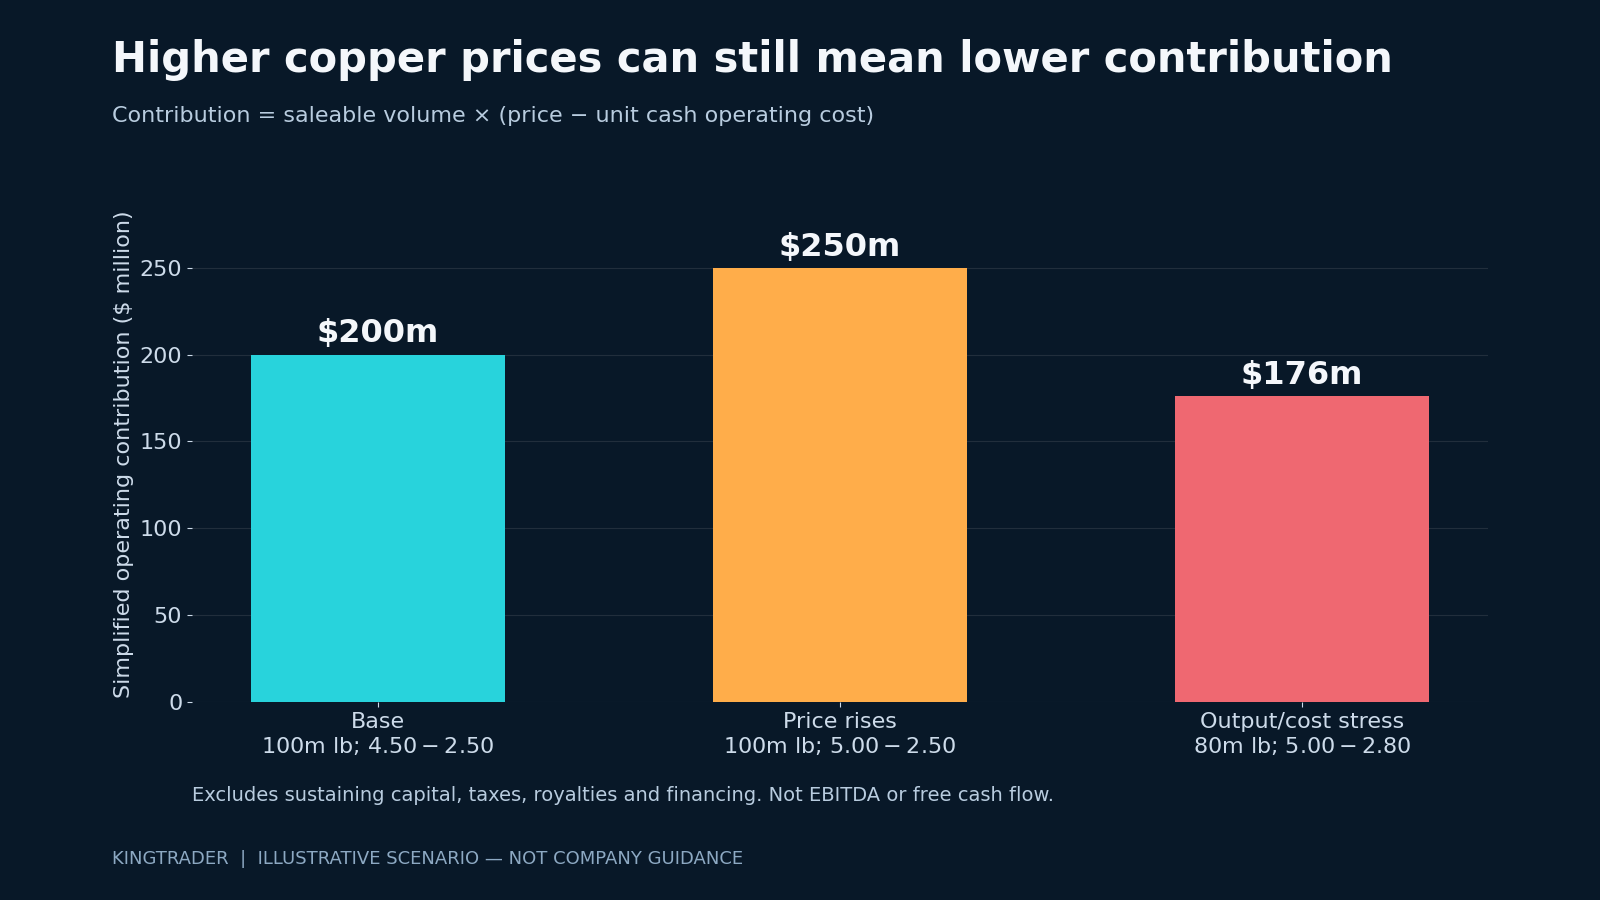
Take a hypothetical producer selling 100 million pounds of copper annually at $4.50 per pound, with cash operating costs of $2.50 per pound. Revenue is $450 million and the simplified operating contribution is $200 million. This contribution excludes sustaining capital, taxes, financing, royalties and other items; it is not EBITDA or free cash flow and is not a model of Freeport.
If price rises to $5.00 with unchanged volume and unit costs, contribution reaches $250 million, up 25% on an 11.1% price increase. That is operating leverage. Now assume saleable volume falls to 80 million pounds and unit costs rise to $2.80 because less production absorbs fixed expenses. At the same $5.00 selling price, contribution is $176 million, 12% below the original case.
The arithmetic explains why a copper miner can disappoint during a metal rally. The relevant sensitivity is price minus cost, multiplied by volume. A more complete model then deducts capital spending, cash taxes and financing. A high-price scenario with lower output and a large repair bill may generate less distributable cash than a lower-price year with stable operations.
This also helps distinguish operators. A low-cost mine with reliable output has a different risk profile from a high-cost development project. A development asset may offer substantial upside to a price increase, but it can also need new financing before production begins. Share issuance can transfer part of that upside away from existing shareholders.
Regional premiums can distort the headline
Trade policy can make copper more valuable in one delivery location than another. Anticipated tariffs may pull inventories toward a country before the policy takes effect. The movement can widen regional price differences without demonstrating an equivalent rise in global end-use demand. September 2026 reporting on metals-market tariff concerns is one reason this distinction deserves attention now.
COMEX and London Metal Exchange contracts should not be compared by their raw quoted numbers. Check units, contract months, deliverable grades, warehouse locations and exchange rules. Dollars per pound must be converted into dollars per tonne before calculating a spread. Even after unit conversion, an apparent gap can reflect transport, financing, insurance and delivery restrictions.
A sophisticated arbitrage trader asks whether metal can actually move between the two delivery systems at the quoted cost and within the required time. A retail trader should not assume that a visible spread is free money. A tariff-driven premium can compress abruptly when policy changes or inventory arrives.
Choose the exposure before choosing the entry
Copper futures give direct contractual exposure but bring leverage, margin requirements and expiry management. A correct long-term thesis can still lose money if a short-term price decline forces liquidation. Position size should reflect the cash needed to survive plausible adverse moves, not merely the amount required to open the trade.
A futures-based fund can experience roll effects and expenses. Its return may differ from a simple change in the spot copper price. Mining shares add management, geological, political, currency and financing risks. A diversified mining fund reduces single-company exposure while introducing other commodities and business lines. None of these instruments is a perfect substitute for the others.
Businesses buying physical copper have a different objective: protect the margin on a sale rather than maximise investment return. Their hedge should match timing, quantity and pricing terms as closely as practical. A futures hedge can still leave basis risk between the benchmark and the supplier’s delivered price. Overhedging turns procurement protection into an unintended speculative position.
A practical decision framework
Write the thesis in a falsifiable form. For a near-term trade, specify the physical catalyst, the expected timing and the data that would contradict it. For a multi-year equity investment, specify the production path, expected costs and funding needs. Do not use a 2035 forecast to justify unlimited patience with a trade designed to last three weeks.
Then build a bear case. What happens if Chinese industrial demand weakens, regional inventory returns to the wider market or the mine misses guidance? How much of a higher copper price is needed merely to offset cost inflation? If the answer is substantial, the company may have less useful commodity exposure than its marketing suggests.
Finally, connect valuation to the earnings cycle. A low price-to-earnings ratio based on peak commodity profits can be more expensive than it appears. Normalise price and costs, allow for sustaining capital and test the balance sheet against a downturn. The strongest physical story can still be a poor investment at the wrong purchase price.
Does a projected shortage guarantee a copper bull market?
No. Demand can change, projects can advance and consumers can substitute or recycle. Even if the shortage develops, the timing and valuation of the chosen instrument determine the return. Structural scarcity supports a research thesis; it does not eliminate trading risk.
What deserves the closest attention now?
Watch saleable production, regional inventories, physical premiums and the conversion of earnings into cash. Those measures connect the long-term electrification narrative to present business performance. Copper is essential infrastructure material, but the market rewards the economics of a position, rather than the importance of the metal alone.
Sources and further reading
- IEA, Global Critical Minerals Outlook 2025
- Reuters, Freeport second-quarter 2026 results
- Freeport, investor news releases
- September 2026 metals tariff discussion
- Related KingTrader analysis: infrastructure spending and returns
KingTrader editorial analysis. Illustrative scenarios are not company guidance, price targets or personalised investment advice.





Leave a Reply