PIVOT POINT FILTERING METHODS
- Take the R-1 and the S-1 initially from all time frames for your analysis, especially in low volume consolidating trading sessions.
- The Pivot Point can be used as an actual trading number in determining the high or low of a given time period, especially in strong bull or bear market conditions.
- In a bearish market the highs should be lower and the lows should be lower. In this case I use the actual Pivot Point up to the R-1 for resistance and the S-2 for support targets.
- In a bullish market the highs should be higher and the lows may be higher than the preceding time period. I use S-1 up to the Pivot Point and the R-2 for targeting the potential trading range.
If in a given trading day, the market goes through my daily target numbers, the importance of the weekly and even monthly numbers is what gives me an indicator for the next major target levels of support and resistance. I use the actual Pivot Point for many things; for example, it is important to understand that it can be used as an actual trading number in determining the high or low of a given time period, especially in strong bull or bear market conditions. In an extremely Bullish market condition, the Pivot Point can become the target low for the trading session.
This number represents the true value of a prior session. In an up-trending market, if the market gaps higher above the Pivot Point, then a retracement back to the Pivot will attract buyers. Until that Pivot Point is broken by prices trading below that level, traders will step in and buy the pullback. The opposite is true in an extremely bearish market condition; the Pivot Point will act as the target high for the session. If a news driven event causes the market to gap lower, traders will then access the news, and once prices come back up to test the Pivot Point, if the market fails to break that level and trade higher, sellers will take action and start pressing the market lower again.
Technically speaking, in a bearish market the highs should be lower and the lows should be lower than the preceding time frame. If they are, then to help me filter out unnecessary information or excessive support and resistance numbers on my charts, I use the actual Pivot Point up to the R-1 number for resistance and then I target the S-2 for the potential low or for that time period’s trading range.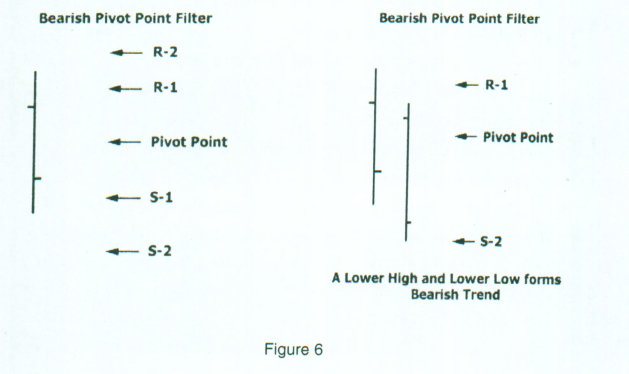
As you can see in the figure 6, if I determine the market is bearish and if I understand the relationship of the geometric distance of the resistance and support targets, I can eliminate the R-2 number, since in a bearish environment we should see a lower high. If I am looking for a lower low, then I can eliminate the S-1 support number as well and now I have reduced the field to just three numbers.
If I apply the same methodology on a daily, weekly and monthly chart now, instead of 39 numbers I am now working with just 9 numbers. Once again, I am not using the numbers to place orders ahead of time (even though you could); I use the numbers as a guide.
These numbers work so well and often act as a self fulfilling prophecy because so many institutions and professional traders do use them; many have different size positions on, some traders may not wait for the exact number to hit and may start scaling out of positions (as I do) and as you should also. With this method you can use these numbers as exit areas on your trades. As figure 7 depicts, in a bullish market environment, by definition, you may agree that the highs should be higher and the lows should be higher than the preceding time period.
When I have determined that we are in a bullish trend, I target the S-1 up to the Pivot Point for the low of the session and the R-2 for targeting the high and that will give me an idea of what the potential trading range will be.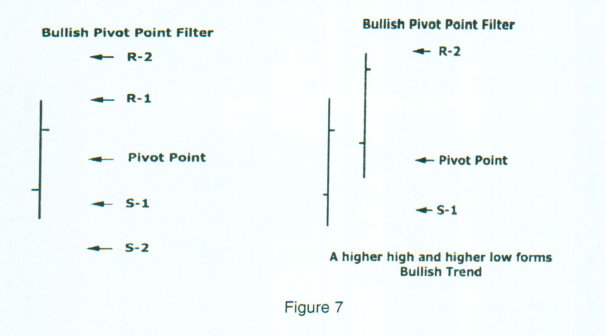
When the market goes through the projected daily target numbers, I then use the next time periods to give me the next reliable price objective. That is where the significance of the weekly and monthly numbers comes into play.
There are several methods to use to help determine whether or not a market is Bullish bearish or neutral. One method is the Open / Close indicator. If after a prolonged uptrend, prices close below the open after two consecutive sessions, you will know the market internals have switched from bullish to bearish. Therefore you could choose the R-1 to the Pivot Point to target the high of the next session down to the S-2 number.
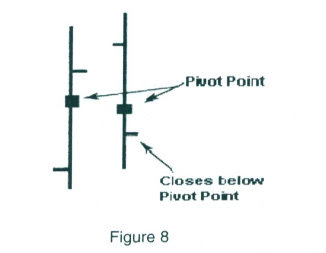
Another method, which is more in line with my moving average methodology, is if the close is below the prior time period’s close, and closes below the open and below the Pivot Point, then the next time period should be considered as a bearish trading session. In figure 8, the square boxes represent the value of that time period’s Pivot Point.
If the market closes below the session’s open, the prior session’s close and below the Pivot Point, then the next time period would be considered a bearish trading session. In this case, I would consider the next time period’s Pivot Point up to the R-1 for a targeted high and the S-2 for a targeted low.
The opposite would be true for a bullish consideration; In Figure 9, if the market closed above the open, above the prior session’s close, and above the Pivot Point, then I would target the next trading session range from the S-1 up to the Pivot Point to the R-2 resistance target level.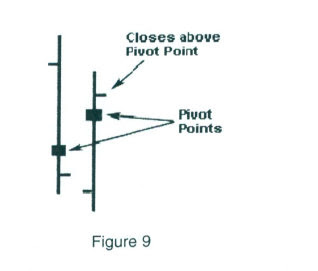
THE IMPORTANCE OF CONFLUENCE
Time is an essential element in trading. Many times traders are correct in their predictions for a top or bottom in a market, but their timing is off which results in a loss. Many analysts were calling for a top or the bubble to burst in the Stock market in 1999. In that situation not demonstrating patience would have resulted in dramatic loss of profit potential, or worse, actual losses due to selling short Tech Stocks too early. How about economists’ predictions of a housing bubble back in 2004 and their expectations for a decline in real estate prices? As of February of 2006 that has not happened. I can go on and on about examples when prognostications were correct, but timing was wrong, resulting in a financial loss.
As I stated earlier, Pivot Point analysis relies on both time and price specifics in its calculations to project future support and resistance levels in the future. By incorporating various time frames such as Daily, Weekly and Monthly price data, the trader can take advantage of price areas that coincide with the different time periods. These price clusters will repel the market’s advance in an uptrend or act as support by causing prices to reverse in a downtrend. This clustering or confluence from more than one time period that converges with another is an awesome event and can translate into a very lucrative set up. The more Confluences or corroborating numbers there are that target a general area, the more significance there is for that specific targeted price level. Pivot Calculations work to pinpoint almost exact times and prices for trades in various markets and can be used to validate other analyses. Remember this phrase, “There is always strength in numbers”! When several Pivot “numbers” line up, there is a great potential for a reaction from these levels. This knowledge, combined with identifying the shift in momentum by identifying and acting upon strong triggers, increases the probability of a successful trade.
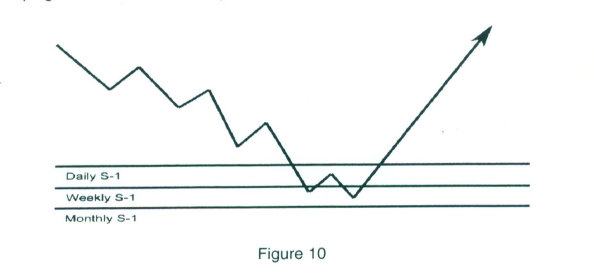
The example in the illustration in figure 10 shows the daily, weekly and monthly Pivot Point numbers drawn across the chart; this gives a trader the heads up that the market may reach an unsustainable extreme or oversold market condition. Just by looking at the graph, one can see the market has been in a prolonged down trend. Generally, the market may stop its descent at a confluence support zone and then you would want to wait for a shift in momentum to trade a potential price reversal. As the market starts to give clues that a bottom is near, you can now determine a low risk entry since a bottom has been defined. What would not be known is how high the market’s reaction will be from this target level of support. This is where the candle chart section will play an important role in helping to determine the strength of the trend reversal.
Let’s examine the next chart in figure 11, which is a daily look at a spot FOREX Euro Currency versus the US Dollar. The Monthly S-2 target low was 116.90, the weekly S-1 lined up in close proximity at 116.58, and the actual low was 116.41. Looking at the market’s reaction three days after the low, we see a bullish engulfing pattern. The confluence of Pivot support numbers gave one of the best and only predictive support targets.
Therefore, it should be noted that the longer term numbers should be watched carefully for clues, not only for trading opportunities to enter positions, but also as a warning that the current trend could be exhausted and potentially reverse. At the very least, you may not have wanted to establish a long position and you certainly would have been alerted not to sell short at the lows.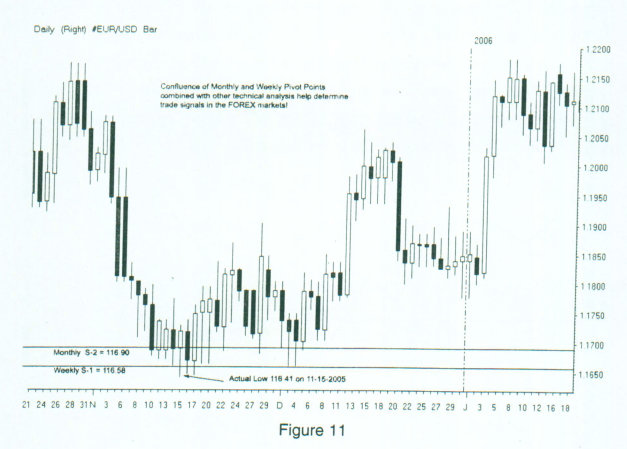
CONFLUENCES WORK AT TOPS
We have all heard in the field of technical analysis that what works for some patterns or signals is not applicable for all situations. However, the power of Pivot Point confluences does work at market tops as well as working to indicate bottom reversals, as we just went over.
In the illustration in figure 12, once again the three main time periods that we use are the monthly, the weekly, and the daily. When a congestion of Pivot numbers line up or cluster near a specific price zone, heighten your awareness for possible reversals.
It is important to note if a market has been in a long uptrend, say more than two months, and if we are close to an end of the quarter, keep in mind that the market is ripe for a profit taking correction. Generally speaking, portfolio managers trading managed funds receive payment by a performance fee (profits) at the end of a quarter. Since many of these large trading entities use Pivot Analysis or are aware that others that use them, when a confluence of resistance develops, especially near the end of a quarter, look out below. It marks not only a prime Resistance price level, but also, there is a specific reason why a profit taking correction can occur at that time period. The same holds true for bottoms. After a long price decline, if the numbers line up and if it is near the end of a quarter, a profit taking reversal could be in the works. That does not mean to say the original trend won’t resume, but you could take a great counter trend reversal trade. Generally speaking, market sell-offs have more velocity, therefore spotting Resistance confluences can be very lucrative opportunities under the right circumstances.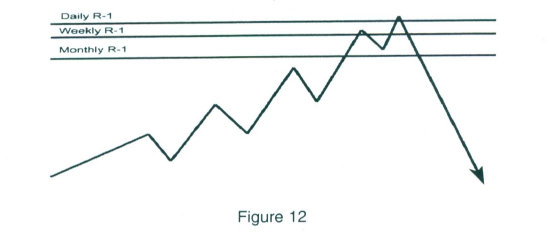
I just explained the phrase “There is always strength in numbers”; the concept can be explained further in that there is a strong analytical value found in the number three, not just in trading and technical analysis, but also in our universe.
As you may be aware, the number three is a Fibonacci number and when I look at confluences in the three different time periods, it represents the three different groups of traders. The daily numbers are used by day traders, the weekly numbers are used by swing traders, and the monthly numbers are used by longer term position traders and institutions. The coincidental factor arrives from the fact that one set of numbers from one time frame generally has nothing to do with another.
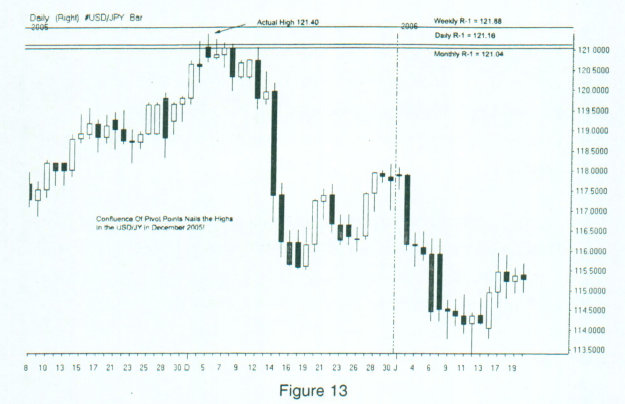
Let’s look at the chart and see how the numbers in the spot FOREX Japanese Yen line up as this chart shows in figure 13. The market made a tremendous price move from the low of 108.76 on September 5th, 2005 until the high was made on December 5th of 2006 at 121.41. First, let’s review before we go further; if you recall in Section one, I stated that FOREX traders can borrow information from the Futures industry.
One such piece of data is the CFTC’s Commitment of Traders report. In essence this report reveals whose hands “control” the market. For all currencies EXCEPT the Yen, currencies are quoted as the currency versus the Dollar. The Yen Futures are quoted as the opposite as the spot FOREX markets. So spot FOREX would quote the Yen as 117.35 the Futures quote is .8572. What this means is when the CFTC report shows a net short position, that means traders are in a long position in the spot Yen FOREX markets against the Dollar.
As the CFTC report showed at the end of the trading session on 11/29/05, the fund, or the non commercial category, was long 22,626 contracts and short 86,626. That is a net short position of 64,000 contracts. Each contract is
1.250.0 worth of Yen! The commercials were long 154,396 contracts and short 85,604 positions. The small speculators were long 29,368 contracts and short 34,160 positions.
This means the banks, or smart money, established a protective hedge position in the Futures, betting that the Spot Yen would fall in value against the dollar. Keep in mind the non- commercial category is considered professional speculators; they too are considered the smart money. The difference is, they are speculating and will not generally take delivery of a Futures contract which is
1.250.0 worth of Japanese Yen.
If we examine figure 13 closely, notice after a substantial price appreciation in a relatively short time period of time, prices hit just past the Monthly R-1 of 121.04. Remember the low on September 5th, just three months earlier, was 108.76. The end of the year and the quarter was closing in and we were hitting up against a confluence of Pivot Point resistance. The Weekly R-1 was 121.77 and the day the actual price high occurred at 121.40, the Daily Pivot R-1 was 121.16. Combining the Pivot Point Resistance levels with a few bearish candle patterns such as the Rickshaw Doji that formed the day before the high, or the trigger to initiate a sell which occurred on the third day after the target high was made, we could develop a strong case to go short. Market tops that align with a cluster or confluence of various Pivot Points can result in tremendous market reversals as this example shows, especially as they coincide with a major consensus reading towards the end of the quarter.
Active Trade Magazine published an article I wrote in the September 2004 issue and made it a cover story. It was on the power of Pivot Point Confluence, and how calculating Pivot Points on more than one time frame can help identify certain price levels that are likely to repel prices. The article was titled, Pivot Points and “Right Side” chart analysis (Pg. 68). You may have in fact read that article or saw the cover, it was the one with President Bush and Sen. Kerry on the cover. The focus was on not only entry prices and risk management, but profit objectives and how to trade around the support and resistance numbers. Since that article was published, many traders have started incorporating the three time periods in their research. That is one reason I have been considered the leading authority on Pivot Point analysis.


Leave a Reply