• Skip to primary navigation
  • Skip to content
  • Skip to primary sidebar

Trading Strategy Library- KINGTRADER.NET

Main navigation

  • Home
  • Learn
    • Beginner Course
    • Stock Trading
    • Day Trading
    • Forex
  • Strategies
    • Chart Patterns
    • Candlestick Patterns
    • Gold & Commodities
    • Psychology & Risk
  • Markets
  • Quizzes
  • Downloads
  • Apps
Home/Chart Patterns

High Tight Flag Chart Pattern And Real Examples

Chart PatternsJul 4, 2020Updated Nov 15, 2026By kingtraderpro1 min read

High Tight Flag Chart Pattern And Real Examples

High, Tight Flags Are Rare

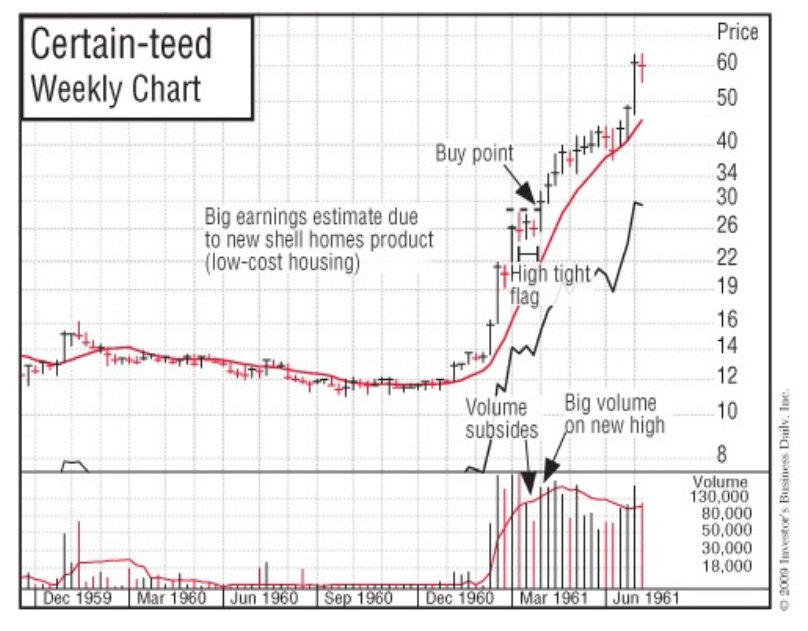
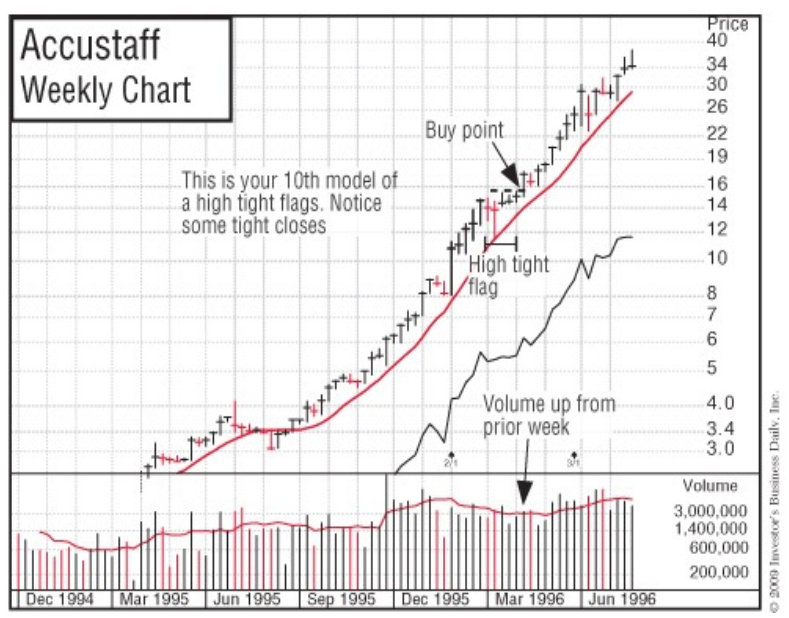
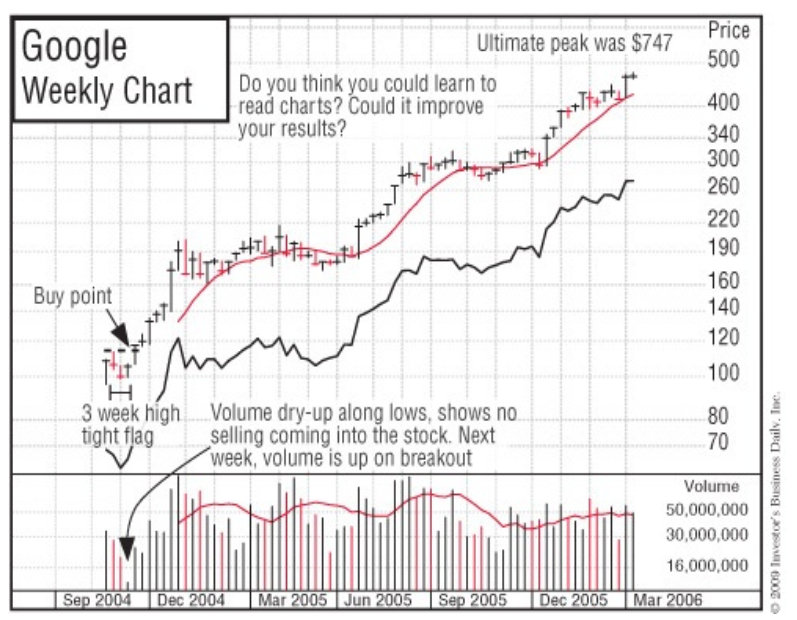
A “high, tight flag” price pattern is rare, occurring in no more than a few stocks during a bull market. It begins with the stock moving generally 100% to 120% in a very short period of time (four to eight weeks). It then corrects sideways no more than 10% to 25%, usually in three, four, or five weeks.

This is the strongest of patterns, but it’s also very risky and difficult to interpret correctly. Many stocks can skyrocket 200% or more off this formation. (See the charts for Bethlehem Steel, May 1915; American Chain & Cable, October 1935; E. L. Bruce, June 1958; Zenith, October 1958; Universal Controls, November 1958; Certain-teed, January 1961; Syntex, July 1963; Rollins, July 1964; Simmonds Precision, November 1965; Accustaff, January 1995; Emulex, October 1999; JDS Uniphase, October 1999; Qualcomm, December 1999; Taser International, November 2003; and Google, September 2004. Each earlier pattern serves as a precedent for each later pattern, so study them carefully.

The E. L. Bruce pattern in the second quarter of 1958, at around $50, provided a perfect chart pattern precedent for the Certain-teed advance that occurred in 1961. Certain-teed, in turn, became the chart model that I used to buy my first super winner, Syntex, in July 1963.

Real Examples For High Tight Flag Chart Pattern

How useful was this post?

Click on a star to rate it!

Average rating 4.6 / 5. Vote count: 10

No votes so far! Be the first to rate this post.

Related articles

  • 100+ Chart Patterns in Technical Analysis Download For Free [PDF| Printable]
  • Wide-and-Loose Chart Pattern And Real Examples
  • Ascending Bases Stock Chart Pattern And Real Examples
  • Base on Top of a Base Chart Pattern And Real Examples

Reader Interactions

Leave a Reply Cancel reply

Your email address will not be published. Required fields are marked *

Primary Sidebar

Recent Posts

  • Tariffs and Supply Chains 2026: When Does Diversification Pay?
  • Private Credit Risks 2026: Is the Yield Turning Into Cash?
  • Copper Trading 2026: Why a Supply Shortage Is Not a Simple Buy Signal
  • AI Power Bottleneck: Who Profits When Data Centres Need Electricity?
  • Gold Trading 2026: Inflation, Real Yields and Miner Risk

Browse by topic

  • Trading Psychology & Risk 13
  • Quizzes 13
  • Stock Trading 11
  • Day Trading 11
  • Chart Patterns 11
  • Markets & Business 9
  • Forex 9
  • Downloads 6
  • Beginner Course 6
  • Gold & Commodities 5
  • Support
  • Contact
  • Disclaimer
  • Terms of Service
  • Privacy Policy

© Copyright 2020 - Best Sources For Stock, Forex And Options Traders